October Toronto Real Estate Market Update

Autumn Arrives And The Market Finds Its Second Wind
November is here. Halloween buckets are empty, sweaters are finally out, and Toronto is easing into that cozy part of fall where the days get shorter but the real estate market usually picks up some energy.
And this October definitely delivered.
After an extremely active September with a huge surge in new listings, October felt more like the market settling into its natural fall rhythm. There were fewer new listings across every major housing type but interestingly sales actually went up. That combination created a much more balanced vibe than what we felt earlier in the season. Buyers were engaged but thoughtful. Sellers faced competition but not the wild flood of listings we saw a month earlier.
Let’s dig into what happened.
What’s Happening
October tends to be a “true pace” month in Toronto real estate. September is energetic because everyone comes back from cottage season and lists everything at once. By contrast, October tells you what the market really wants to do.
This year that meant a slight cooling in new listings but a healthy bump in sales as buyers got more serious. And while prices moved differently depending on the segment, most categories stayed fairly stable or saw modest improvement. Condos especially showed stronger sales activity which helped absorb some inventory.
Freeholds behaved like typical fall freeholds. Reasonable demand. Solid interest. Still price sensitive. If a house was clean, well presented, and priced properly it moved. If it wasn’t, it sat.
Condos had more energy than we’ve seen for a while. Higher sales, steady pricing, and more confident consumers. There is still a lot of choice for condo buyers but the improving sales numbers show that confidence is returning slowly.
In short, October was healthier than September in some ways because the activity was driven by real buyers and not just a flood of new supply.
Tyson’s Take
October felt like a market finding its balance again. Fewer new listings but more sales. Stable pricing. Stronger condo activity. More confident buyers but not competitive chaos.
If you are buying this fall, it is still a great time. There is lots of inventory and very manageable competition. You can take your time, compare options, negotiate, and make smart moves without feeling rushed.
If you are selling, strategy matters. With inventory still high and buyers picky, presentation and pricing are everything. The homes that hit the market clean, polished, and correctly priced are the ones getting the attention.
Short term we will likely see a softer November before things wind down for the holidays. Long term nothing has changed for Toronto. Demand remains strong, the city continues to grow, and the fundamentals supporting real estate here remain rock solid.
You've read my personal opinion, but now here are the cold, hard numbers. 📊
Please note that these statistics cover only the City of Toronto. Not Richmond Hill, Not Mississauga, Not Vaughan, etc. If you would like to know what's happening in another area in GTA, please reach out and let me know. I'm happy to chat!
Want to look on your own and see the numbers for yourself? Just ask and I'll send you the official statistics that every Real Estate agent gets sent from TREB and uses for their market updates. These are the exact numbers I use for my Toronto updates and if you want, I can prepare an update as detailed as this blog update for your city, neighbourhood and even street/building!
Don't be shy, reach out and just ask!
📊 NEW LISTINGS — OCTOBER 2025
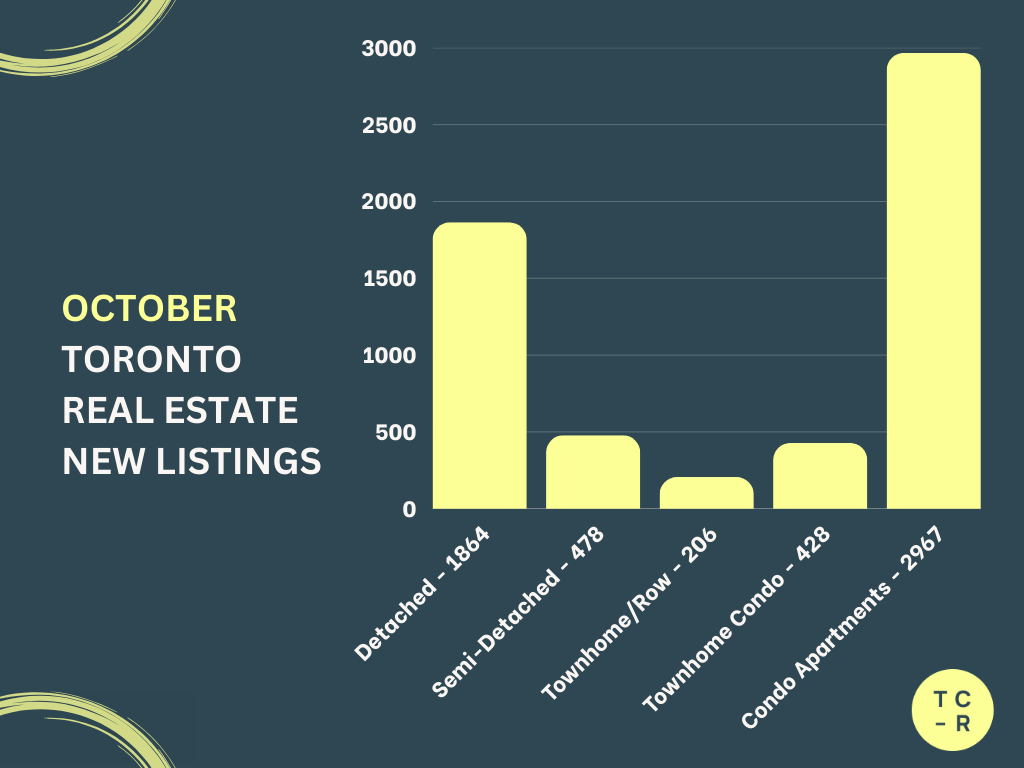
Detached:
2,377 → 1,864 (−21.59%)
Semi-Detached:
572 → 478 (−16.43%)
Freehold Townhomes:
242 → 206 (−14.88%)
Condo Townhomes:
499 → 428 (−14.23%)
Condo Apartments:
3,431 → 2,967 (−13.52%)
📌 Key Takeaway:
After September’s huge post-summer surge, October brought a very normal pullback in new listings. The rush to list faded across every housing type, especially detached homes. This wasn’t sellers losing confidence — it was simply the market settling into a more sustainable fall pace after an unusually busy September.
📊 ACTIVE LISTINGS — OCTOBER 2025
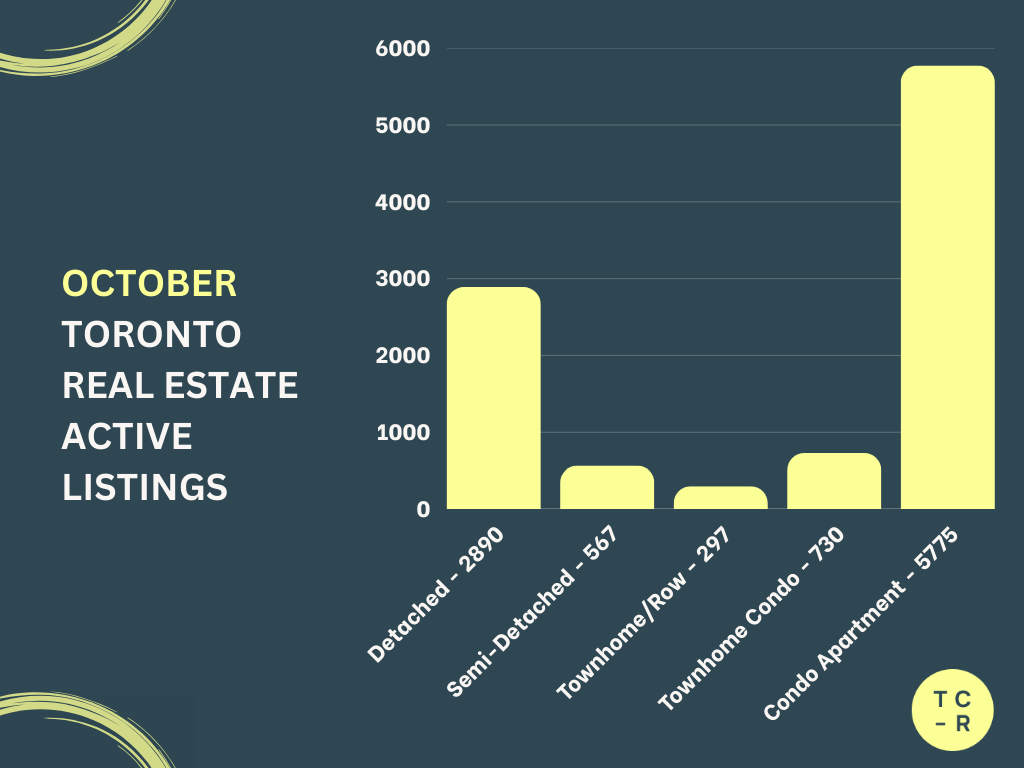
Detached:
2,938 → 2,890 (−1.63%)
Semi-Detached:
596 → 567 (−4.87%)
Freehold Townhomes:
296 → 297 (+0.34%)
Condo Townhomes:
751 → 730 (−2.80%)
Condo Apartments:
5,971 → 5,775 (−3.28%)
📌 Key Takeaway:
Despite fewer new listings in October, overall inventory barely moved. This tells us that buyer activity picked up just enough to offset the slowdown in new supply. The market remained balanced, with buyers still enjoying choice and sellers needing strong pricing and presentation to stand out.
📊 SALES — OCTOBER 2025
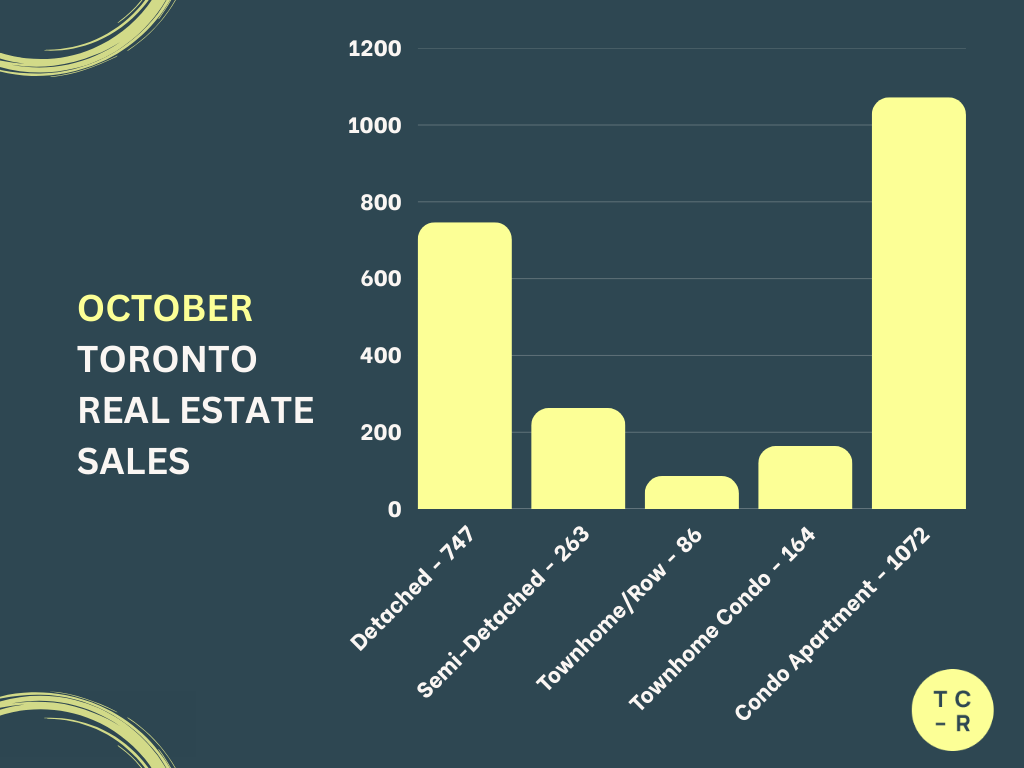
Detached:
675 → 747 (+10.67%)
Semi-Detached:
214 → 263 (+22.90%)
Freehold Townhomes:
81 → 86 (+6.17%)
Condo Townhomes:
139 → 164 (+17.99%)
Condo Apartments:
940 → 1,072 (+14.04%)
📌 Key Takeaway:
Sales improved across every housing category in October, which was one of the most encouraging signals in the report. While September was dominated by a surge in listings, October showed buyers stepping up and making decisions. Semis and condos led the charge, reflecting strong demand for well-located, more attainable housing options.
📊 AVERAGE PRICE — OCTOBER 2025
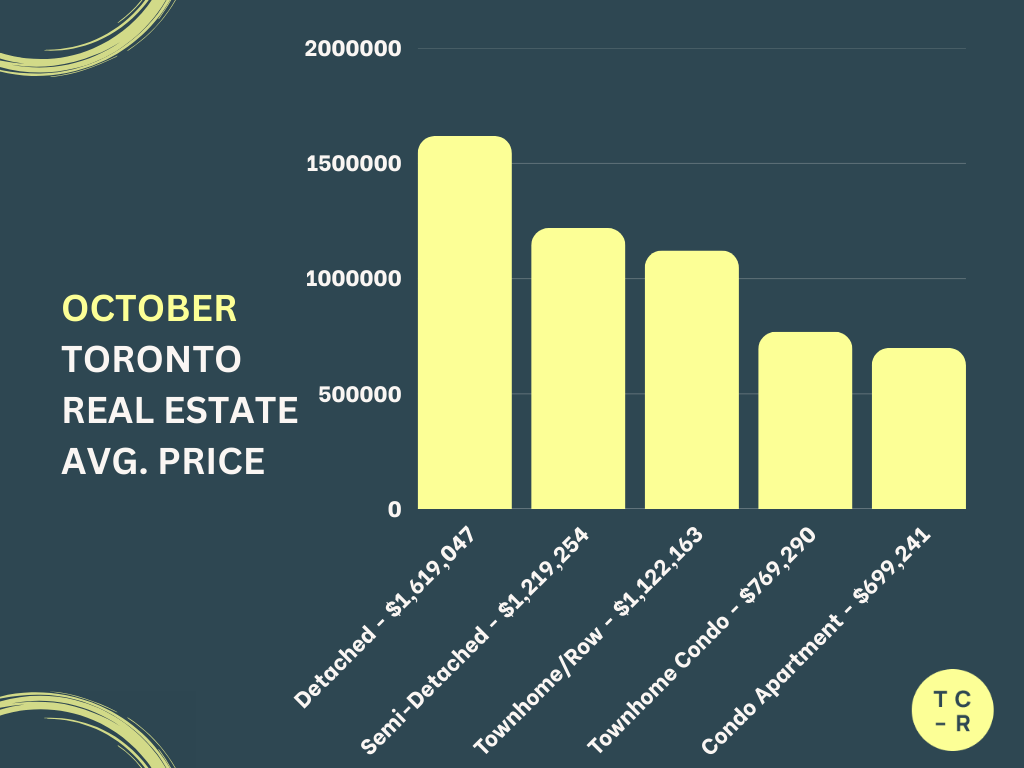
Detached:
$1,686,013 → $1,619,047 (−3.97%)
Semi-Detached:
$1,184,672 → $1,219,254 (+2.92%)
Freehold Townhomes:
$1,174,864 → $1,122,163 (−4.48%)
Condo Townhomes:
$786,671 → $769,290 (−2.21%)
Condo Apartments:
$681,145 → $699,241 (+2.66%)
📌 Key Takeaway:
Pricing moved in both directions depending on the segment. Detached and freehold townhomes cooled slightly after strong September pricing, while semis and condos saw modest gains. This wasn’t a market-wide price shift — it was a reflection of changing buyer focus and the mix of homes selling month to month.
📊 DAYS ON MARKET BEFORE SOLD — OCTOBER 2025

Detached:
25 → 24 (−4.00%)
Semi-Detached:
22 → 21 (−4.55%)
Freehold Townhomes:
26 → 30 (+15.38%)
Condo Townhomes:
36 → 32 (−11.11%)
Condo Apartments:
39 → 38 (−2.56%)
📌 Key Takeaway:
Most property types sold slightly faster in October, especially condos and semis. Freehold townhomes were the exception, taking longer to sell as buyers became more selective in that segment. Overall, the pace of the market remained healthy, particularly for homes that were priced correctly and showed well.
Thanks for reading and have a great day! — Tyson CR
If you would like to know the current value of your home or what is happening in your neighbourhood just reach out. I am happy to prepare a free, no obligation custom market report for you anytime.
And if you or anyone you know is planning a move, feel free to get in touch. Every situation is unique and deserves a smart, personalized plan.
Subscribe to receive the latest blog posts to your inbox every month.

