November Toronto Real Estate Market Update

The fall market has officially ended, and the energy we saw in September and early October has shifted into a more typical late-season rhythm. November often acts as a reality check for both buyers and sellers. The rush of fall listings slows. Sales begin to soften. And the market reveals what demand really looks like heading into winter.
This November followed that pattern closely. Nothing dramatic, nothing alarming, just a steady, predictable cooling as Toronto prepares for the quieter holiday season.
So, let's break it down and see what exaclty happend!
What’s Happening...
November tends to be a transitional month. Buyers who needed to purchase before year-end have mostly done so, and sellers who didn’t find the right offer in October often decide to pause until spring. That leads to softer sales numbers and fewer new listings, and that’s exactly what we saw across every housing category.
Freeholds eased in both sales and new supply. Condos followed the same trajectory, although condo prices held more stable than freeholds. Active listings declined modestly, which is normal, homeowners aren’t listing in late November unless they have a strong reason to move.
What stands out this month is not volatility, but consistency. Prices didn’t swing wildly. Inventory didn’t collapse. Sales didn’t spike or plummet. It was simply a market cooling the way Toronto markets typically do when the year wraps up.
This is the kind of environment that feels less exciting but more informative. It gives you a true sense of underlying demand without the noise of seasonal rushes.
A Quick Word About the Media
It’s worth addressing how real estate news is reported in Toronto because November is the kind of month where headlines often mislead.
Media outlets have a job to attract clicks, and “sales dropped in November” sounds dramatic even though it happens every single year. Without context, seasonal patterns can be spun as market crashes or sudden downturns.
The truth is:
- November almost always sees fewer new listings
- Sales almost always dip heading into the holidays
- Days on market almost always increase
But the fundamentals didn’t worsen this month. Prices didn’t collapse. Inventory didn’t surge. Demand didn’t evaporate.
When you look past the headlines, the data shows a market behaving exactly the way Toronto behaves every late fall. Nothing more, nothing less.
You've read my personal opinion, but now here are the cold, hard numbers. 📊
Please note that these statistics cover only the City of Toronto. Not Richmond Hill, Not Mississauga, Not Vaughan, etc. If you would like to know what's happening in another area in GTA, please reach out and let me know. I'm happy to chat!
Want to look on your own and see the numbers for yourself? Just ask and I'll send you the official statistics that every Real Estate agent gets sent from TREB and uses for their market updates. These are the exact numbers I use for my Toronto updates and if you want, I can prepare an update as detailed as this blog update for your city, neighbourhood and even street/building!
Don't be shy, reach out and just ask!
📊 NEW LISTINGS — NOVEMBER 2025
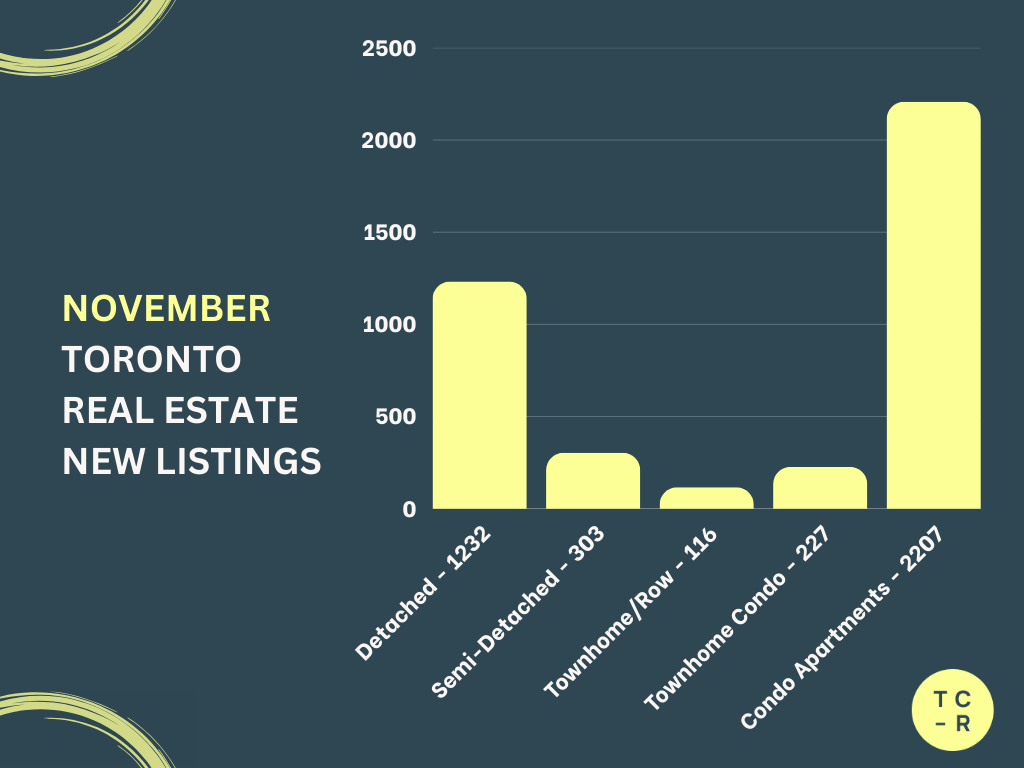
Detached:
1,864 → 1,232 (−33.91%)
Semi-Detached:
478 → 303 (−36.61%)
Freehold Townhomes:
206 → 116 (−43.69%)
Condo Townhomes:
428 → 277 (−35.28%)
Condo Apartments:
2,967 → 2,207 (−25.62%)
📌 Key Takeaway:
New listings dropped sharply across every housing type in November, which is completely normal for this time of year. Sellers tend to step back as the holidays approach, and this month was no exception. The decline was most pronounced in freehold townhomes and semis, reinforcing that many homeowners are choosing to wait until spring rather than list late in the year.
📊 ACTIVE LISTINGS — NOVEMBER 2025
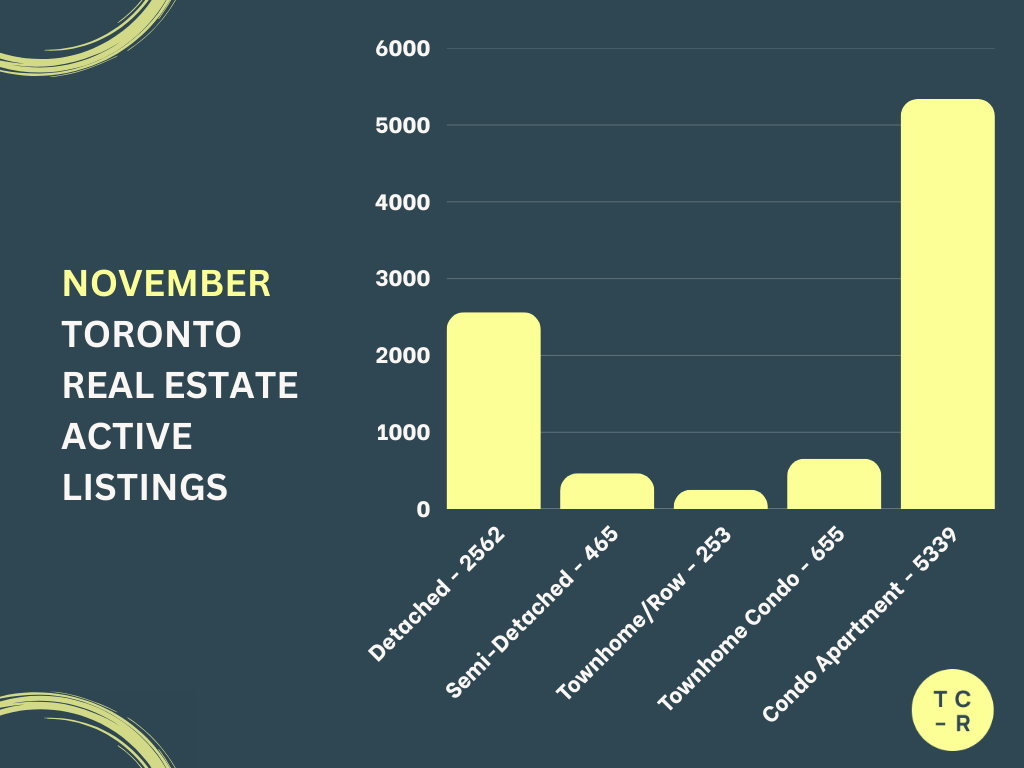
Detached:
2,890 → 2,562 (−11.35%)
Semi-Detached:
567 → 468 (−17.46%)
Freehold Townhomes:
297 → 253 (−14.81%)
Condo Townhomes:
730 → 655 (−10.27%)
Condo Apartments:
5,775 → 5,339 (−7.55%)
📌 Key Takeaway:
Active listings declined across the board, showing that inventory is slowly being absorbed as fewer new homes come to market. Condos still offer the most choice for buyers, but even there, supply is trending lower. This is a typical late-fall pattern rather than a sign of tightening conditions.
📊 SALES — NOVEMBER 2025
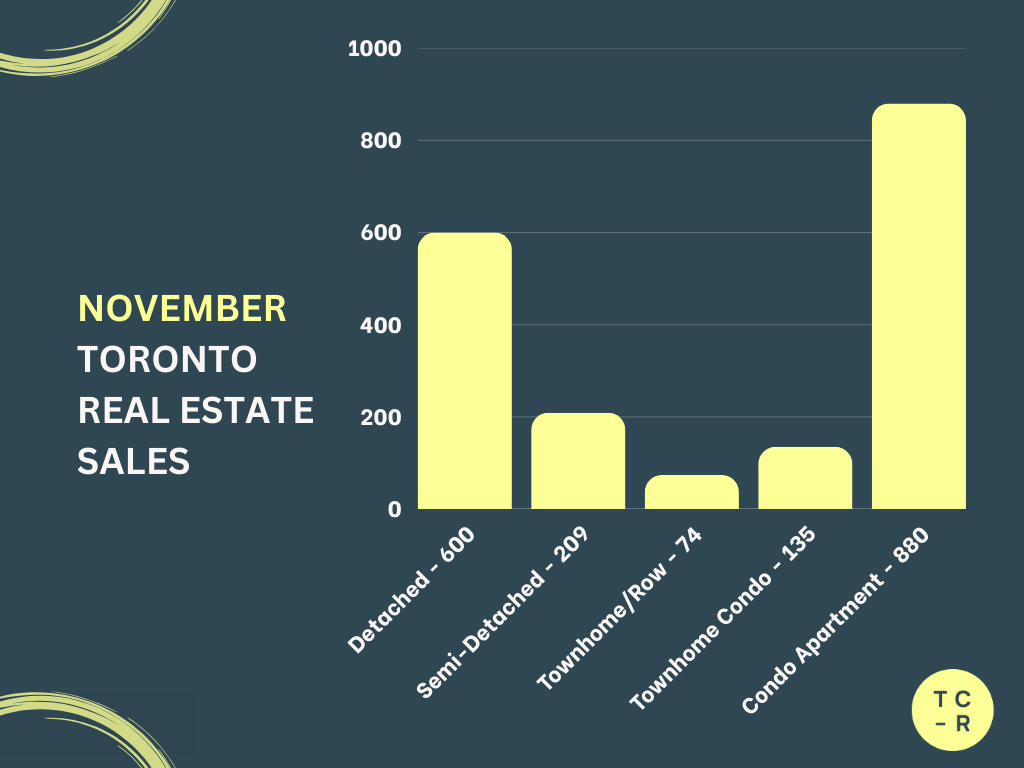
Detached: 600
Semi-Detached: 209
Freehold Townhome / Row: 74
Condo Townhome: 135
Condo Apartment: 880
Key Takeaway:
Sales pulled back from October, which again is a normal seasonal pattern. Detached and semi-detached saw moderate declines. Condo apartments had the highest activity by volume but still dipped month-over-month. Nothing in the numbers suggests a demand collapse — buyers simply move more slowly in late fall, and many wait until after the holidays to re-enter the market.
📊 AVERAGE PRICE — NOVEMBER 2025
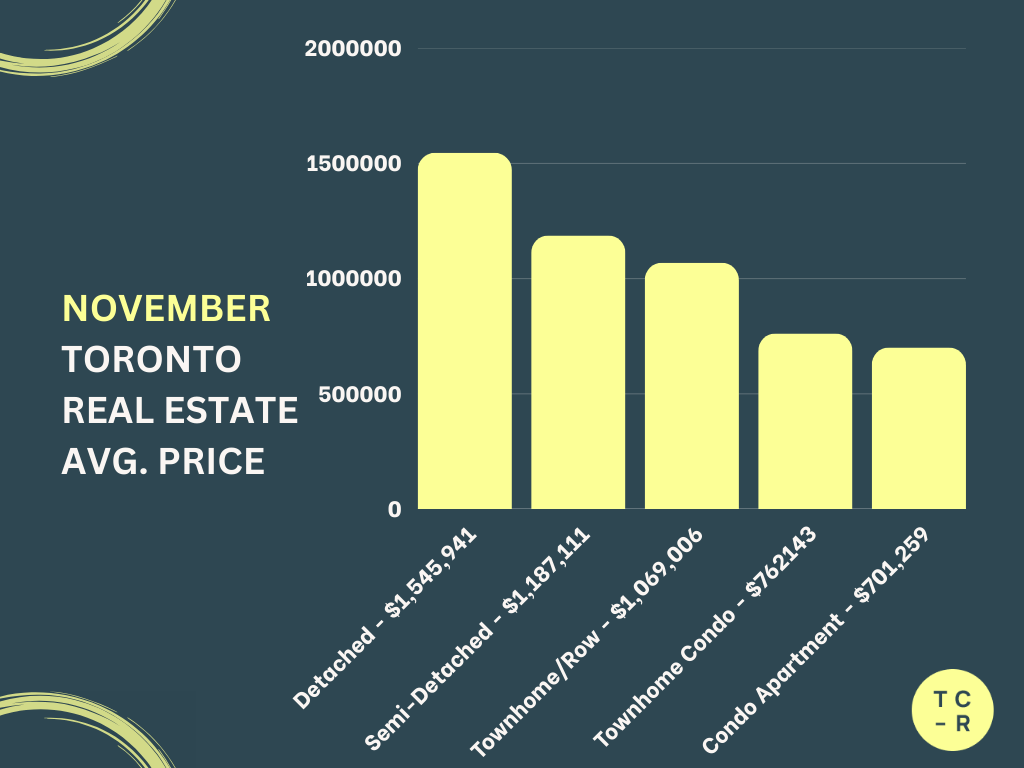
Detached: $1,545,941
Semi-Detached: $1,187,111
Freehold Townhome / Row: $1,069,006
Condo Townhome: $762,143
Condo Apartment: $701,259
Key Takeaway:
Prices held steady in most categories this month. Detached dipped slightly from October, which had a stronger mix of higher-end sales. Semi-detached and condos remained stable. There were no dramatic price swings, which reinforces the idea that the market is cooling seasonally rather than reacting to financial pressure or economic shock.
📊 DAYS ON MARKET BEFORE SOLD — NOVEMBER 2025
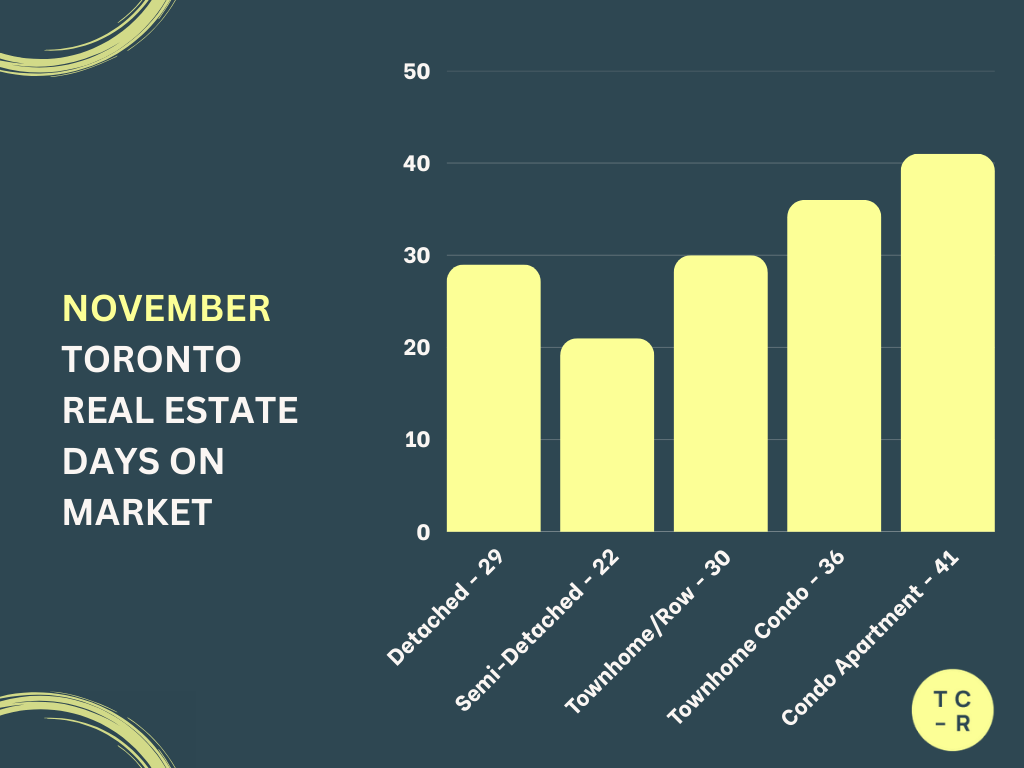
Detached: 29 days
Semi-Detached: 21 days
Freehold Townhome / Row: 30 days
Condo Townhome: 36 days
Condo Apartment: 41 days
Key Takeaway:
Homes took slightly longer to sell this month, especially condos. That’s expected as activity slows. Buyers who remain active in late fall often take their time, compare options, and negotiate more. Listings that are priced appropriately still move, but the break-neck pace of early fall is behind us.
A Quick Word About the Media
It’s worth addressing how real estate news is reported in Toronto because November is the kind of month where headlines often mislead.
Media outlets have a job to attract clicks, and “sales dropped in November” sounds dramatic even though it happens every single year. Without context, seasonal patterns can be spun as market crashes or sudden downturns.
The truth is:
- November almost always sees fewer new listings
- Sales almost always dip heading into the holidays
- Days on market almost always increase
But the fundamentals didn’t worsen this month. Prices didn’t collapse. Inventory didn’t surge. Demand didn’t evaporate.
When you look past the headlines, the data shows a market behaving exactly the way Toronto behaves every late fall. Nothing more, nothing less.
Ok! That's it for now. Thanks for reading and have a great day! 👋 - Tyson CR
Want to know what the current value of your home is or what's going on in your neighbourhood?
Please feel free to reach out! I'm happy to prepare a completely free, no obligation custom market report just for you
If you or anyone is thinking of a move don’t be shy and reach out.
After all, everyone’s individual situation requires an individual and unique strategy and plan.
Subscribe to receive the latest blog posts to your inbox every month.

