March Toronto Real Estate Market Update

(Based on March 2026 sales, reported in April | 416 only)
March is where the Toronto real estate market typically finds its stride.
February gives us early momentum, but March is when the spring market really starts to take shape. More listings hit the market, more buyers become active, and we begin to see how supply and demand are going to interact through the busiest season of the year.
This March followed that pattern. Listings increased across every property type, sales activity continued to improve, and homes generally sold faster compared to earlier in the year.
And just like every March in Toronto, there’s a bit of everything in the air. The sun starts appearing again, the weather is warmer, the Jays are getting ready to start their season (who else is excited?!), and the city starts to feel a little more alive again.
Real estate is no different. The energy is back, but it’s still early enough that things haven’t gone full Spring crazy mode.
Let’s take a closer look!
What’s Happening
March brought a clear increase in both supply and demand.
New listings rose across all housing types as sellers prepared for the spring market. At the same time, sales continued to climb, showing that buyers are absorbing much of that new inventory.
Low rise homes, particularly detached and semi detached, continued to show strong demand with faster selling times and steady price growth.
The condo segment remains more balanced. Inventory continues to build, giving buyers more options, while pricing shows more variability depending on the unit, location, and condition.
Overall, this is a market that is becoming more active, but still remains grounded. The balance between supply and demand is holding, which is helping prevent sharp price swings in either direction.
Before We Get Into the Numbers
March is often the first month where the market feels fully “awake.”
Buyers who were watching in January and February are now making decisions. Sellers who were waiting for better conditions are now listing. The result is a noticeable increase in both activity and competition.
What stands out this year is how measured everything still feels.
Even with more listings and stronger sales, the market is not moving aggressively. Buyers are active, but still cautious. Sellers are entering the market, but not flooding it. And most importantly, transactions are happening in a way that feels more balanced than what we’ve seen in past peak markets.
If anything, it feels a bit like the Raptors getting back into the playoffs after a few quieter seasons. There’s momentum building again, confidence is returning, but no one is assuming anything is guaranteed.
This is not a market being driven by urgency. It is being driven by informed decisions and realistic expectations.
With that in mind, let’s look at the numbers.
The Numbers
You've read my personal opinion, but now here are the cold, hard numbers. 📊
Please note that these statistics cover only the City of Toronto. Not Richmond Hill, Not Mississauga, Not Vaughan, etc. If you would like to know what's happening in another area in GTA, please reach out and let me know. I'm happy to chat!
Want to look on your own and see the numbers for yourself? Just ask and I'll send you the official statistics that every Real Estate agent gets sent from TREB and uses for their market updates. These are the exact numbers I use for my Toronto updates and if you want, I can prepare an update as detailed as this blog update for your city, neighbourhood and even street/building!
Don't be shy, reach out and just ask!
📊 NEW LISTINGS
February to March
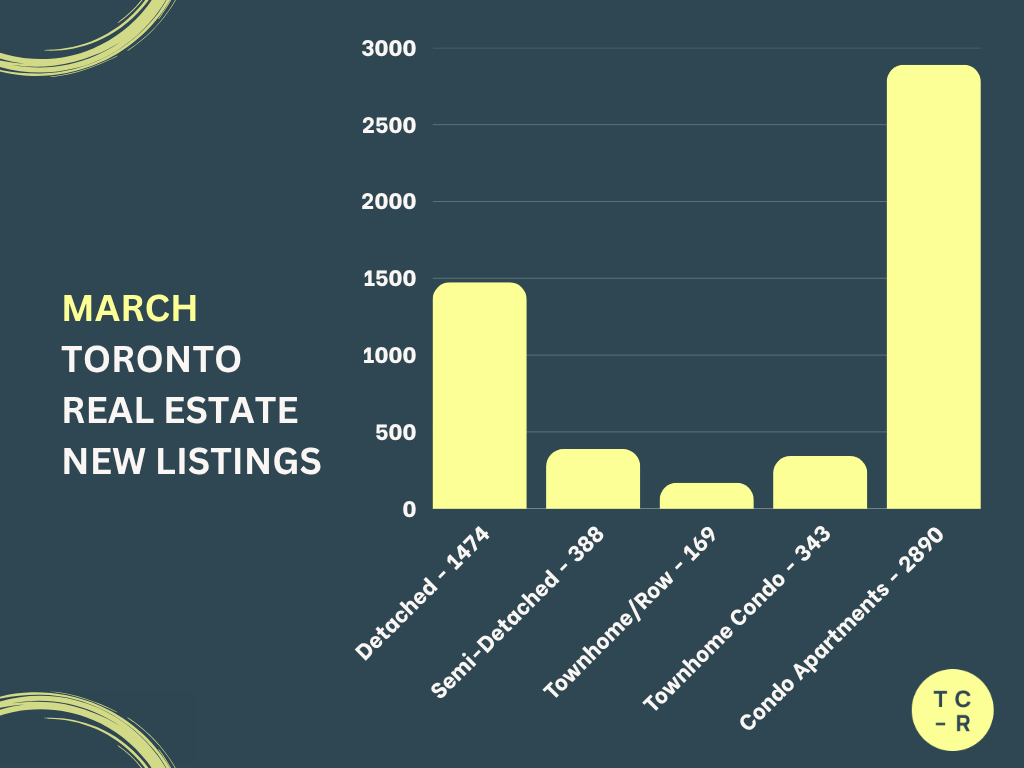
Detached:
1,093 → 1,474 (+34.86%)
Semi Detached:
272 → 388 (+42.65%)
Freehold Townhomes:
137 → 169 (+23.36%)
Condo Townhomes:
260 → 343 (+31.92%)
Condo Apartments:
2,246 → 2,890 (+28.69%)
Key Takeaway
New listings increased significantly across every property type, which is typical for March. Sellers are clearly returning to the market in preparation for the spring season, with the largest increases seen in low rise homes.
📊 ACTIVE LISTINGS
February to March
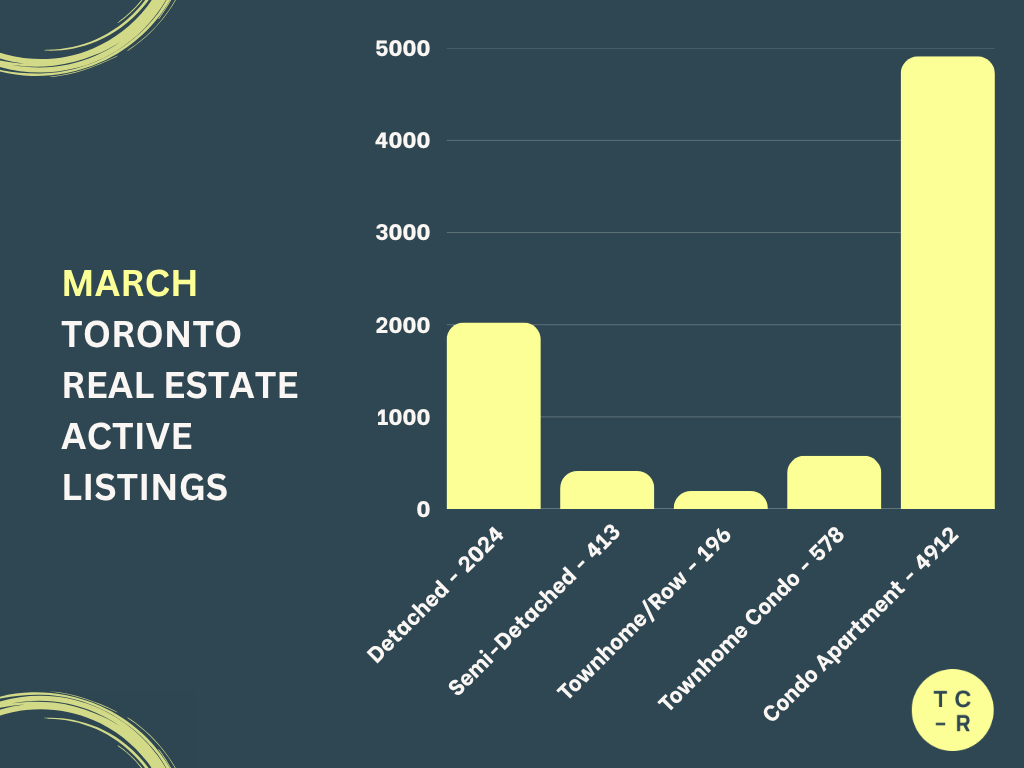
Detached:
1,775 → 2,024 (+14.03%)
Semi Detached:
327 → 413 (+26.30%)
Freehold Townhomes:
187 → 196 (+4.81%)
Condo Townhomes:
518 → 578 (+11.58%)
Condo Apartments:
4,529 → 4,912 (+8.46%)
Key Takeaway
Inventory continued to build in March as new listings outpaced sales. Buyers now have more choice across all segments, particularly in the condo market, while freehold inventory remains relatively tighter.
📊 SALES
February to March
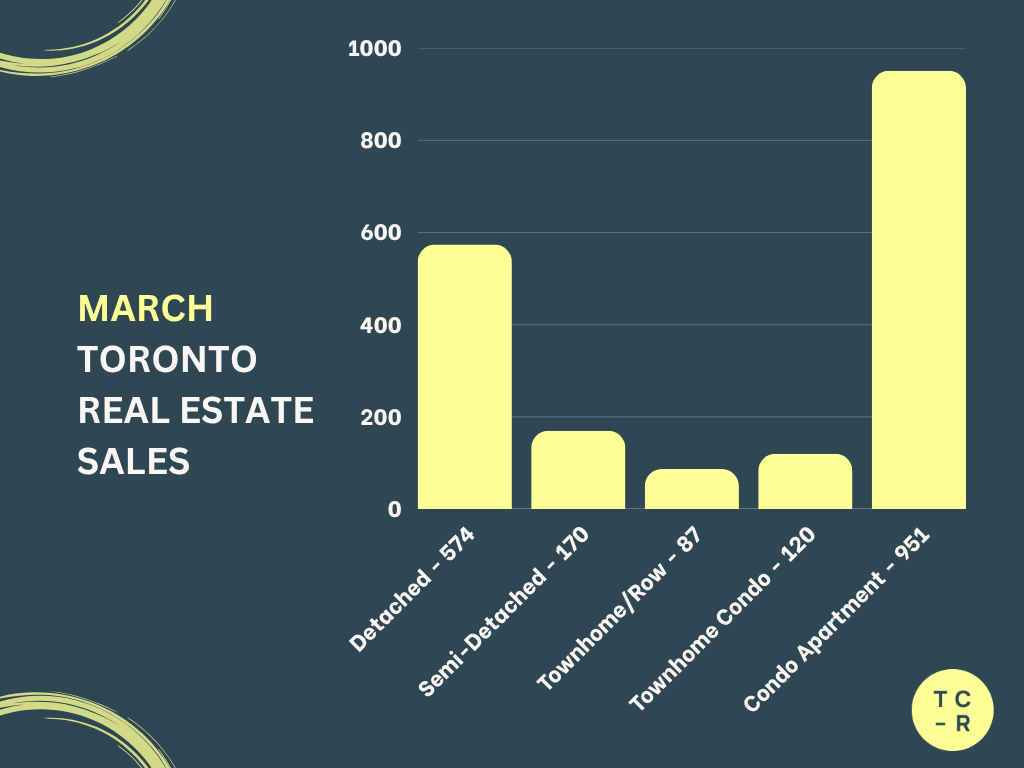
Detached:
437 → 574 (+31.35%)
Semi Detached:
150 → 170 (+13.33%)
Freehold Townhomes:
47 → 87 (+85.11%)
Condo Townhomes:
106 → 120 (+13.21%)
Condo Apartments:
733 → 951 (+29.74%)
Key Takeaway
Sales increased across all property types, with particularly strong growth in detached homes and freehold townhomes. This confirms that buyer activity is continuing to build as we move deeper into the spring market.
📊 AVERAGE PRICE
February to March
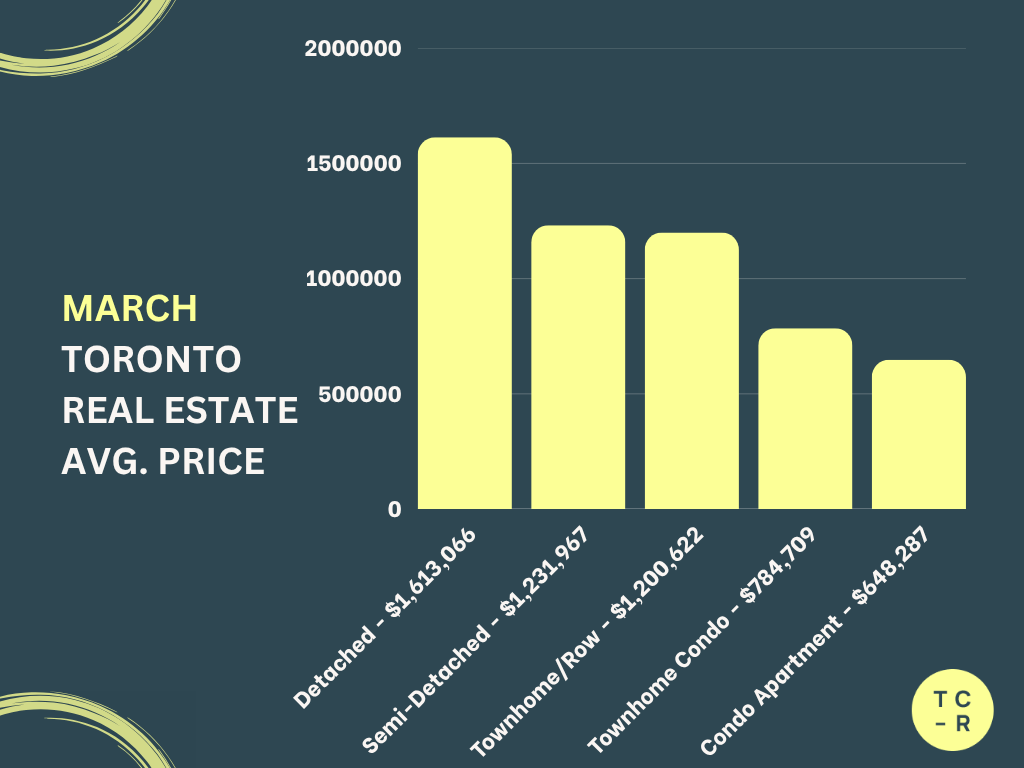
Detached:
$1,568,543 → $1,613,066 (+2.84%)
Semi Detached:
$1,229,853 → $1,231,967 (+0.17%)
Freehold Townhomes:
$1,215,245 → $1,200,622 (-1.20%)
Condo Townhomes:
$875,946 → $784,709 (-10.42%)
Condo Apartments:
$663,984 → $648,287 (-2.36%)
Key Takeaway
Price movement was mixed in March. Detached homes saw moderate growth, while semis remained stable. Condo prices pulled back, particularly in the condo townhome segment, reflecting higher supply and continued price sensitivity among buyers.
📊 DAYS ON MARKET
February to March

Detached:
30 → 24 (-20.00%)
Semi Detached:
20 → 19 (-5.00%)
Freehold Townhomes:
23 → 29 (+26.09%)
Condo Townhomes:
39 → 37 (-5.13%)
Condo Apartments:
43 → 37 (-13.95%)
Key Takeaway
Most property types sold faster in March, especially detached homes and condo apartments. Freehold townhomes were the exception, taking longer to sell as buyers became more selective in that segment.
Tyson’s Take
March confirmed that the spring market is now in full motion.
Listings are up, sales are up, and homes are generally selling faster. But despite the increase in activity, this is still a market that feels balanced rather than aggressive.
Buyers are engaged, but they are not rushing. They are comparing options, analyzing value, and making decisions carefully. That is keeping the market grounded, even as activity increases.
The difference between segments is also becoming more noticeable.
Low rise homes continue to perform well, with steady demand and relatively stable pricing. The condo market, on the other hand, continues to offer more inventory and more variability in pricing, which creates opportunities for buyers who are prepared.
If February was the warm up, March feels more like opening day for the Jays. The season is starting, the energy is building, and everyone is watching to see how things play out over the next couple of months.
Looking ahead, April and May will be the true test of the spring market. If sales continue to keep pace with the increase in listings, we should see a stable and active season. If listings begin to outpace demand more significantly, buyers will gain even more leverage.
For buyers, preparation and timing will be key. For sellers, strong presentation and accurate market analysis will continue to make the difference.
Ok! That's it for now. Thanks for reading and have a great day! 👋 - Tyson CR
Want to know what the current value of your home is or what's going on in your neighbourhood?
Please feel free to reach out! I'm happy to prepare a completely free, no obligation custom market report just for you
If you or anyone is thinking of a move don’t be shy and reach out.
After all, everyone’s individual situation requires an individual and unique strategy and plan.
Subscribe to receive the latest blog posts to your inbox every month.

