June Toronto Real Estate Market Update

(Based on June 2026 sales, as reported in July. Toronto Specific)
Hello friends!
The World Cup is in full swing and as the world watches and enjoys, it seems like everything is kind of on pause. But, does that include the Toronto real estate market?
Well, yes and no. See, June is kind of like the awkward middle child of the Spring and Summer markets. April and May are typically the busiest months of the year, and by the time June arrives, sales are still happening but, slowing down and things usually begin to shift towards the "Lazy Summer" months of July and August.
What we tend to see is less urgency and more selectivity. Buyers continue to be active, but they are more measured in their approach. Sellers are still listing in the market, but expectations and strategy start to matter more.
And this was very much the theme this month.
So, in a nutshell, the market was still chugging along in June, but as always successful sales are increasingly dependent on pricing strategy, condition, and how well a property aligns with current expectations.
📈 Big Picture General Takeaways
Freehold housing types, particularly detached and semi-detached homes, had less new listings & sales but continued to show consistency in pricing, though inventory is gradually increasing. Buyers in these segments remain active but are more selective than earlier in the year.
The condo market continues to operate under higher supply conditions, which is creating longer decision timelines and more negotiation room for buyers. Even with improved sales activity in some areas, inventory levels remain very high (supply outweighing demand).
Before We Get Into the Numbers
What sells quickly and what sits often comes down to how well a listing aligns with current market conditions. Homes that are positioned correctly from the start tend to attract attention early, while those that miss the mark can take significantly longer to gain traction.
At the same time, buyers are becoming more informed (ahem, house sigma doom scrollers) and more disciplined. They are comparing recent sales more closely, watching price adjustments, and taking their time before making decisions. That level of awareness is shaping how negotiations and offer strategies are playing out.
Overall, the market is rewarding sellers and buyers who know what is going on...now, in their neighbourhood. When pricing and presentation align with demand, sales follow. When they don’t, properties tend to linger until expectations adjust.
With that in mind, let’s take a look at what the numbers actually show what happened in Toronto this June.
You've read my personal opinion, but now here are the cold, hard numbers. 📊
Please note that these statistics cover only the City of Toronto. Not Richmond Hill, Not Mississauga, Not Vaughan, etc. If you would like to know what's happening in another area in GTA, please reach out and let me know. I'm happy to chat!
Want to look on your own and see the numbers for yourself? Just ask and I'll send you the official statistics that every Real Estate agent gets sent from TREB and uses for their market updates. These are the exact numbers I use for my Toronto updates and if you want, I can prepare an update as detailed as this blog update for your city, neighbourhood and even street/building!
Don't be shy, reach out and just ask!
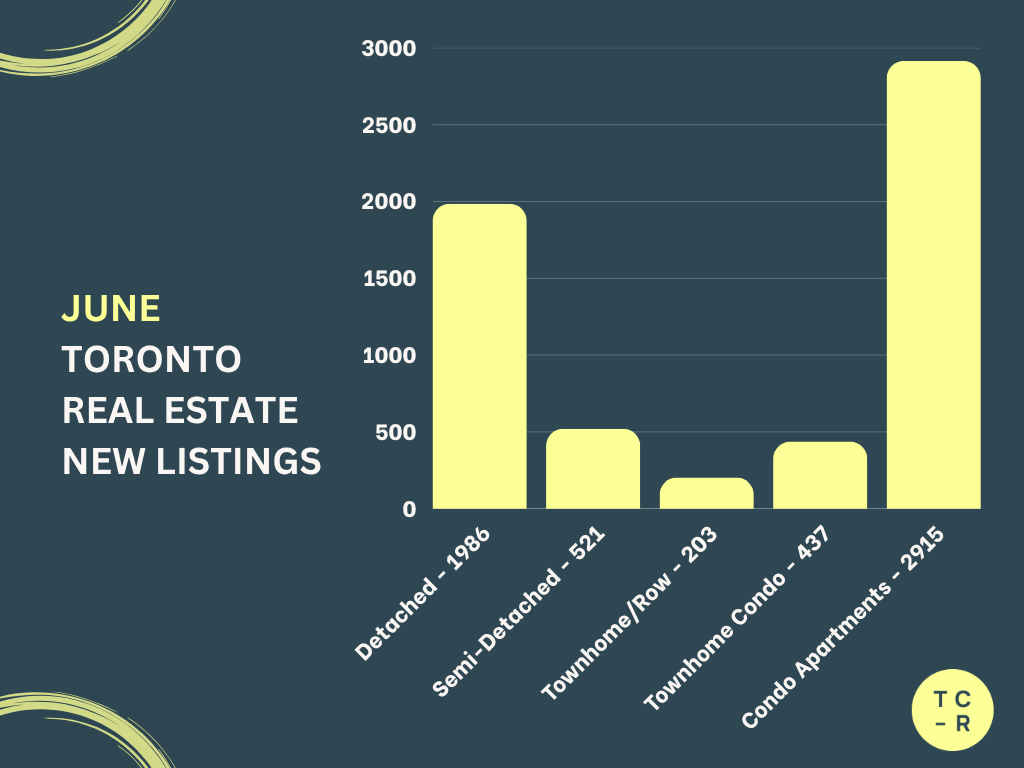
📊 NEW LISTINGS
Detached Homes
2,092 → 1,986 (5.1% decrease)
Semi Detached Homes
513 → 521 (1.6% increase)
Freehold Townhomes
224 → 203 (9.4% decrease)
Condo Townhomes
494 → 437 (11.5% decrease)
Condo Apartments
3,032 → 2,915 (3.9% decrease)
Key Takeaway
New listings eased across most housing types in June, which isn't entirely surprising. April and May typically represent the peak of the spring market, so a slowdown in new inventory heading into summer is fairly typical. Semi detached homes were the only segment to see a small increase, while condo listings and freehold homes all experienced modest declines.
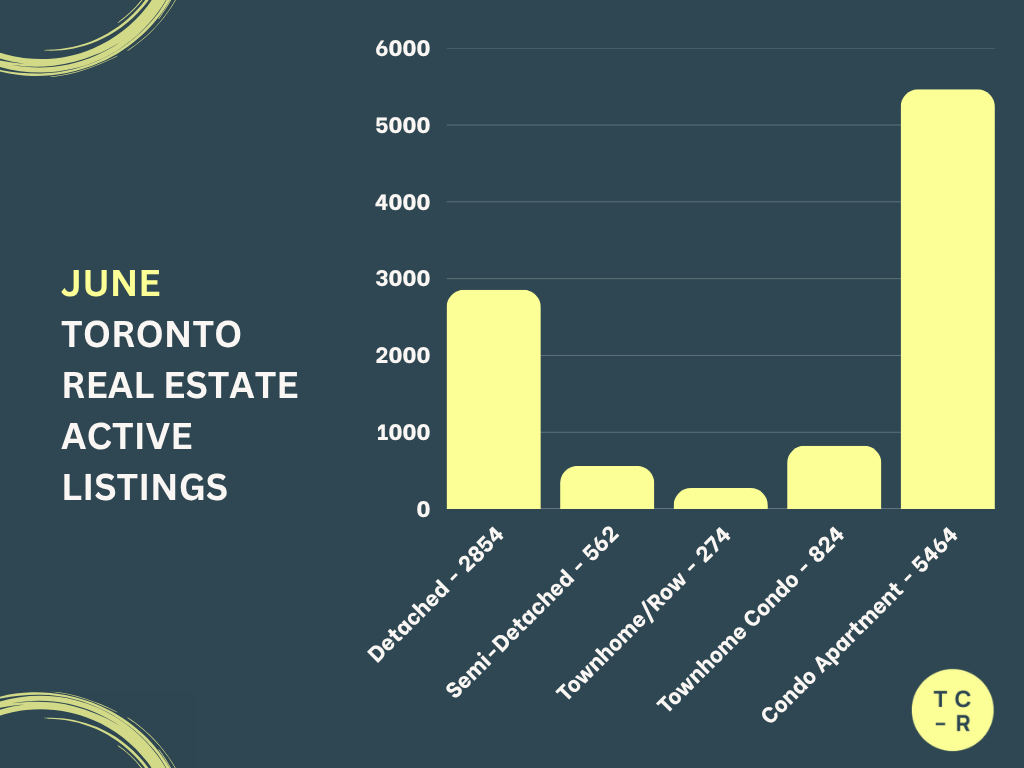
📊 ACTIVE LISTINGS
Detached Homes
2,768 → 2,854 (3.1% increase)
Semi Detached Homes
520 → 562 (8.1% increase)
Freehold Townhomes
270 → 274 (1.5% increase)
Condo Townhomes
786 → 824 (4.8% increase)
Condo Apartments
5,490 → 5,464 (0.5% decrease)
Key Takeaway
Inventory remains elevated across most market segments. While fewer new listings came to market in June, homes are generally taking longer to sell than they were earlier in the spring. That has allowed inventory to continue building, giving buyers more choice and a little more negotiating power.
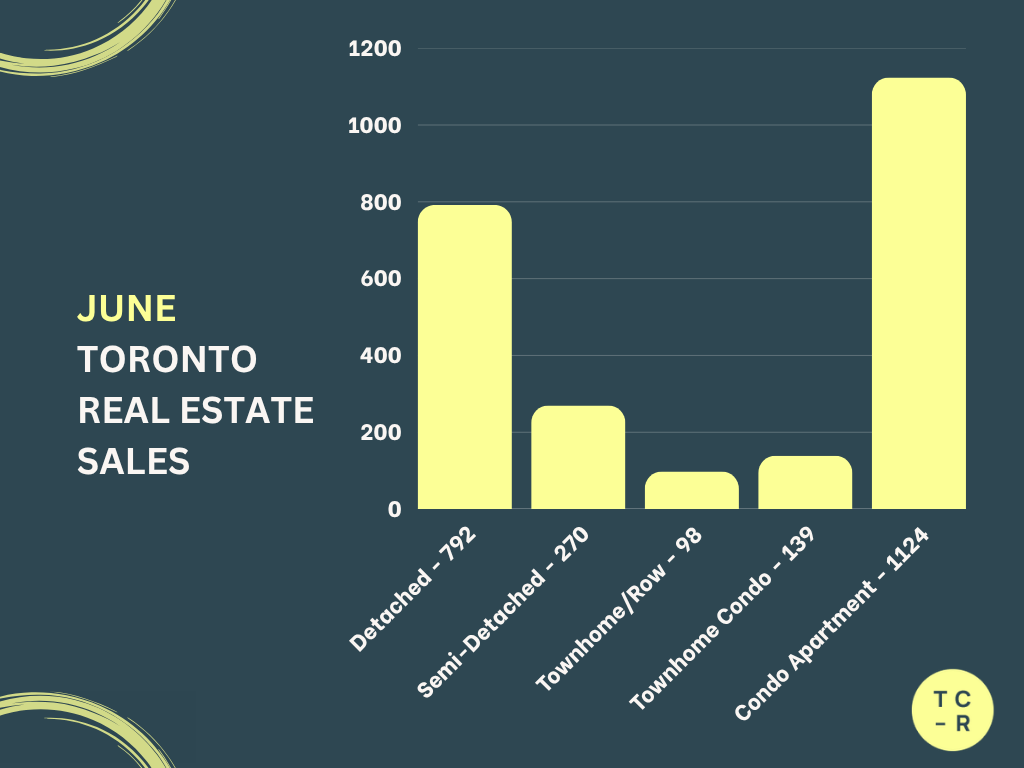
📊 SALES
Detached Homes
846 → 792 (6.4% decrease)
Semi Detached Homes
283 → 270 (4.6% decrease)
Freehold Townhomes
93 → 98 (5.4% increase)
Condo Townhomes
129 → 139 (7.8% increase)
Condo Apartments
1,009 → 1,124 (11.4% increase)
Key Takeaway
Sales activity became more mixed in June. Freehold homes generally experienced a slight slowdown compared to May, while both condo segments actually recorded stronger sales. This suggests that buyers continue to see value in the condo market, where inventory remains plentiful and negotiating opportunities are more common.
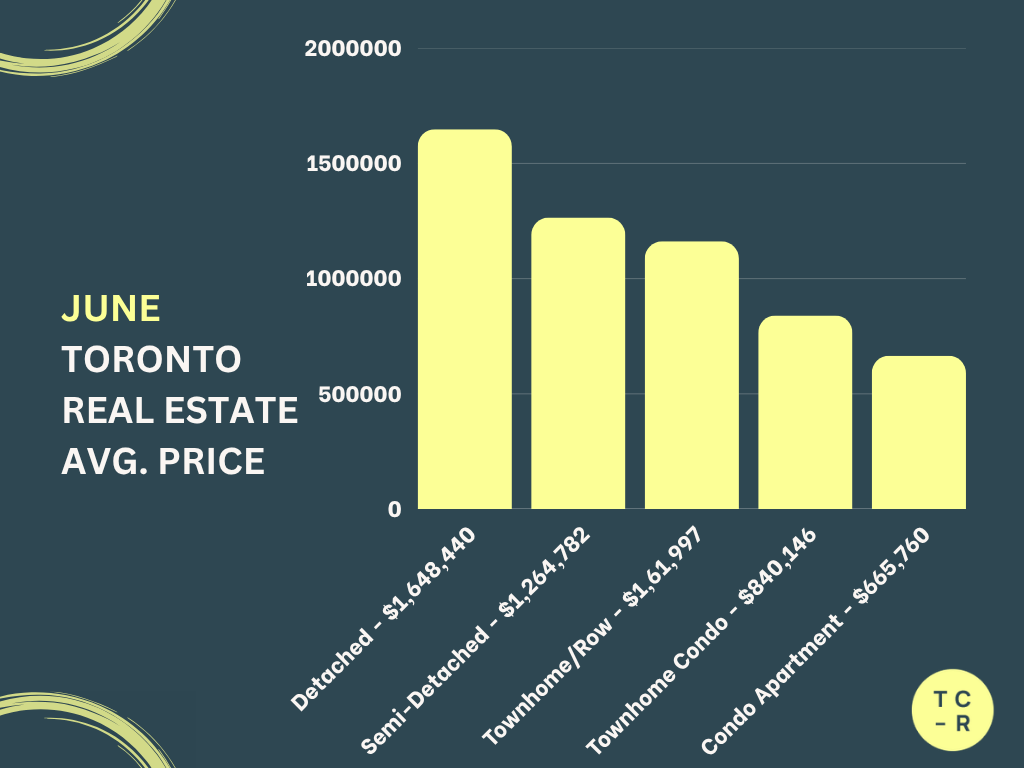
📊 AVERAGE PRICE
Detached Homes
$1,610,998 → $1,648,440 (2.3% increase)
Semi Detached Homes
$1,293,268 → $1,264,782 (2.2% decrease)
Freehold Townhomes
$1,112,188 → $1,161,997 (4.5% increase)
Condo Townhomes
$839,926 → $840,146 (essentially unchanged)
Condo Apartments
$673,841 → $665,760 (1.2% decrease)
Key Takeaway
Prices remained relatively stable throughout June. Detached homes and freehold townhomes posted modest gains, while condo apartments and semi detached homes experienced slight declines. Overall, there is little evidence of broad price swings, with most segments continuing to hold their value despite softer seasonal activity.
📊 DAYS ON MARKET
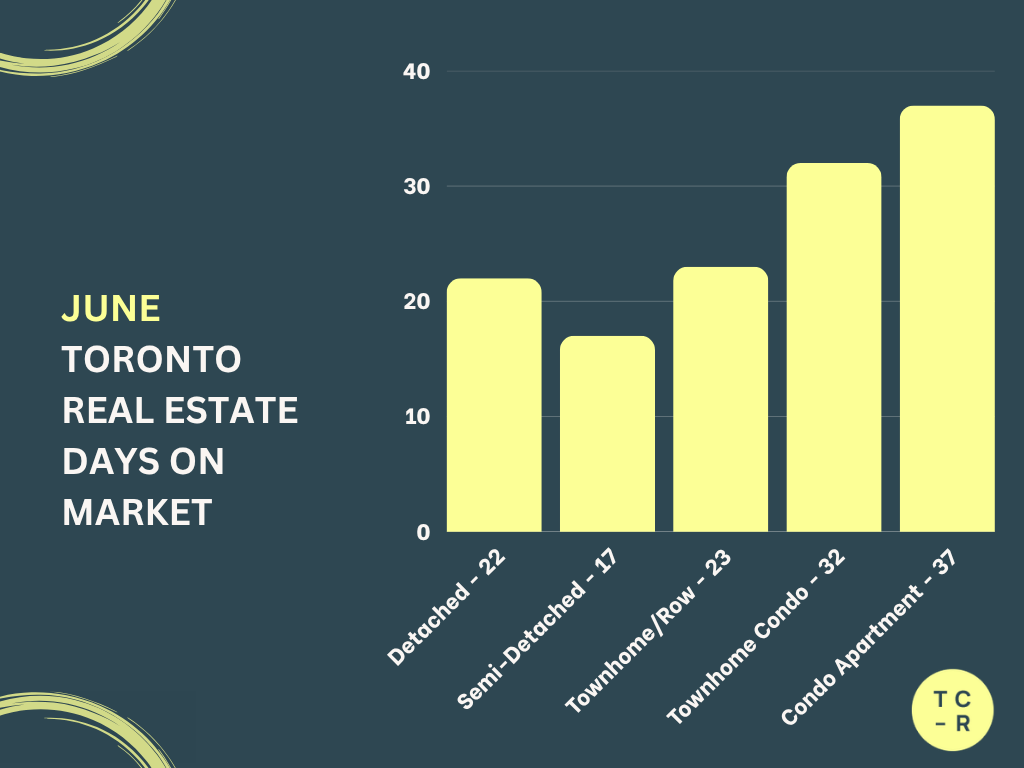
Detached Homes
21 → 22 (4.8% increase)
Semi Detached Homes
17 → 17 (no change)
Freehold Townhomes
20 → 23 (15.0% increase)
Condo Townhomes
27 → 32 (18.5% increase)
Condo Apartments
33 → 37 (12.1% increase)
Key Takeaway
Homes generally took longer to sell in June, which is consistent with the seasonal slowdown that often begins after the busy spring market. Condo townhomes experienced the largest increase in selling time, while semi detached homes continued to move quickly, highlighting ongoing demand for that segment.
Ok! That's it for now. Thanks for reading and have a great day! 👋 - Tyson CR
Want to know what the current value of your home is or what's going on in your neighbourhood?
Please feel free to reach out! I'm happy to prepare a completely free, no obligation custom market report just for you
If you or anyone is thinking of a move don’t be shy and reach out.
After all, everyone’s individual situation requires an individual and unique strategy and plan.
Subscribe to receive the latest blog posts to your inbox every month.


