July Toronto Real Estate Market Update

By
Full name
11 Jan 2022
5 min read
Share this post
Subscribe to newsletter

Subscribe to receive the latest blog posts to your inbox every week.

By subscribing you agree to with our Privacy Policy.
Thank you! Your submission has been received!
Oops! Something went wrong while submitting the form.
(Based on July 2026 sales, as reported in August. Toronto Specific)

Hello friends!

Well, we officially made it through July.

The sun was out, patios were full, people were away at cottages and on vacation, and, perhaps unsurprisingly, the Toronto real estate market seemed to take a bit of a vacation too.

After a fairly active spring market, July brought a noticeable slowdown across Toronto. Fewer homes came to market, fewer properties sold in most categories, homes generally took longer to sell and average prices softened across much of the market.

But before anyone starts ringing the alarm bells, context matters.

July and August are typically two of the slowest months of the year for Toronto real estate.

People are on vacation, kids are out of school, schedules change and, let's face it, spending a Saturday afternoon at an open house isn't always particularly appealing when it's 30 degrees outside and there's a patio calling your name.

So, seeing the market slow down in July isn't exactly surprising.

The more important question is how it slowed down.

And that's where this month's numbers get a little more interesting.

📈 Big Picture General Takeaways

The biggest theme in July was slower activity on both sides of the market, but particularly from sellers.

New listings declined across every property type, and in several categories the drop was substantial. Semi-detached new listings fell 36.7%, detached listings dropped 27.7%, freehold townhomes declined 24.1% and condo townhomes fell 22.2%.

Sales also declined across most categories, but generally not by nearly as much.

That's an important distinction.

If sales were falling while new listings continued pouring onto the market, we'd expect inventory to keep building.

Instead, the opposite happened.

Active listings declined across every property type in July.

That tells us the summer slowdown wasn't simply buyers stepping away from the market. Sellers pulled back too, and in several categories they pulled back considerably more.

Freehold properties still experienced some noticeable month-to-month price declines and generally took longer to sell, so I certainly wouldn't describe this as a suddenly competitive seller's market.

But the relationship between new listings, sales and active inventory is worth watching.

The condo market remains its own story. Condo apartments still had more than 5,200 active listings at the end of July, meaning buyers continue to have plenty of choice.

Condo townhomes, however, had a particularly interesting month, with new listings falling 22.2% while sales actually increased 10.8%.

Overall, July looks less like one side of the market suddenly disappearing and more like Toronto real estate collectively slowing down for the summer.

Before We Get Into the Numbers

I think July is a good example of why it's important not to look at one statistic in isolation.

You could look at average prices falling in four out of five property categories and assume the market suddenly took a turn for the worse.

But then you look at inventory and see that active listings declined across every single property type.

Then you look at new listings and see that fewer sellers brought their homes to market.

Then you look at sales and see that activity slowed, but certainly didn't disappear.

And then there's days on market, which tells us buyers are generally taking more time to make decisions.

Put all of that together and the picture becomes a little clearer.

This looks less like a market suddenly falling apart and more like a market that simply slowed down for the summer.

And again, July and August are usually the slowest months for Toronto real estate, so some degree of slowdown should be expected.

Of course, that doesn't mean we ignore the numbers.

The real test will come as we approach the fall market.

If buyers and sellers return after Labour Day, July and August may simply end up being the usual summer slowdown.

If activity remains subdued into September and October, then we'll have something much more interesting to talk about.

With that in mind, let's take a look at what the numbers actually show happened in Toronto this July.

You've read my personal opinion, but now here are the cold, hard numbers. 📊

Please note that these statistics cover only the City of Toronto. Not Richmond Hill, Not Mississauga, Not Vaughan, etc. If you would like to know what's happening in another area in the GTA, please reach out and let me know. I'm happy to chat!

Want to look on your own and see the numbers for yourself? Just ask and I'll send you the official statistics that every Real Estate agent gets sent from TREB and uses for their market updates.

These are the exact numbers I use for my Toronto updates and, if you want, I can prepare an update as detailed as this blog update for your city, neighbourhood and even street/building!

Don't be shy, reach out and just ask!

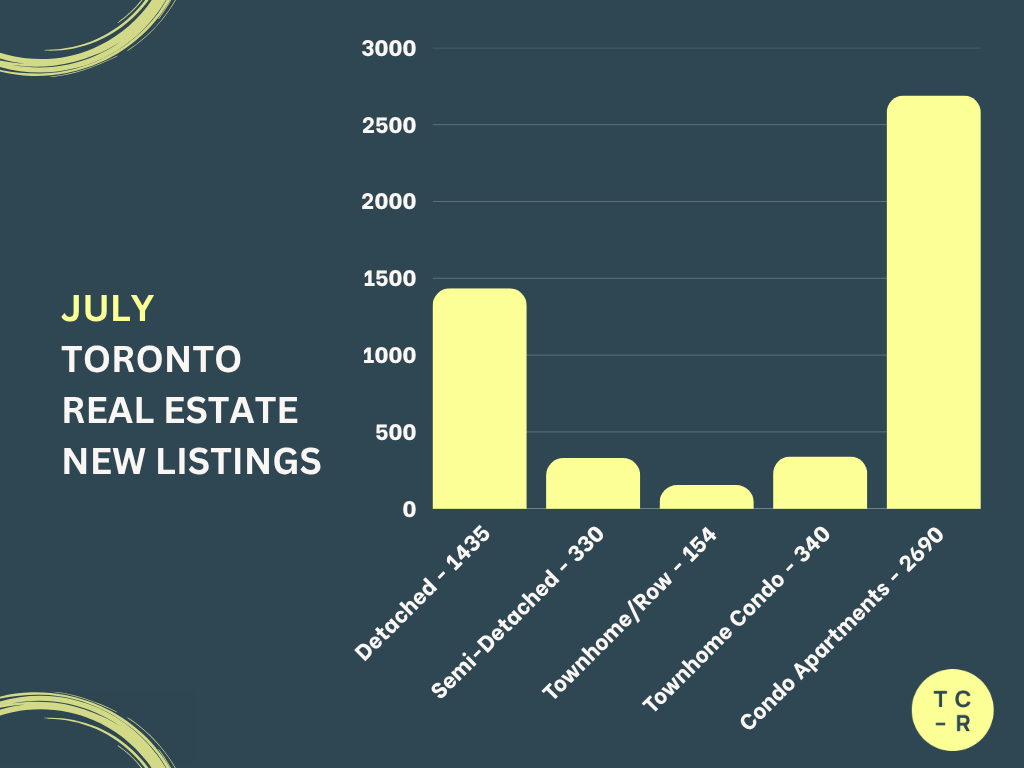
📊 NEW LISTINGS
Detached Homes

1,986 → 1,435 (27.7% decrease)

Semi Detached Homes

521 → 330 (36.7% decrease)

Freehold Townhomes

203 → 154 (24.1% decrease)

Condo Townhomes

437 → 340 (22.2% decrease)

Condo Apartments

2,915 → 2,690 (7.7% decrease)

Key Takeaway

New listings declined across every property type in July, and in some categories the drop was pretty significant.

Semi-detached homes saw the largest decline, with 36.7% fewer new listings hitting the market compared to June. Detached homes weren't far behind at 27.7%, followed by freehold townhomes at 24.1% and condo townhomes at 22.2%.

Condo apartments were the outlier. New listings still declined, but by a much more modest 7.7%.

Now, seeing fewer listings in July isn't particularly surprising. We're moving deeper into the summer and historically there simply aren't as many homeowners rushing to put a property on the market as there are during the spring.

But here's where things get interesting.

In most categories, new listings fell considerably more than sales did.

Detached listings fell 27.7%, while sales declined 12.8%.

Semi-detached listings fell 36.7%, while sales declined 13.7%.

Freehold townhome listings fell 24.1%, while sales declined only 3.1%.

And condo townhome listings fell 22.2%, while sales actually increased 10.8%.

That's an important piece of context.

Yes, buyer activity slowed in July, but sellers pulled back even more dramatically in several parts of the market.

So this isn't simply a story of buyers disappearing. There were fewer buyers making moves, but there were also considerably fewer new properties coming up for sale.

And as we'll see in the next section, that reduction in new supply was enough to start bringing Toronto's overall active inventory down as well.

📊 ACTIVE LISTINGS

Detached Homes

2,854 → 2,607 (8.7% decrease)

Semi Detached Homes

562 → 459 (18.3% decrease)

Freehold Townhomes

274 → 225 (17.9% decrease)

Condo Townhomes

824 → 727 (11.8% decrease)

Condo Apartments

5,464 → 5,228 (4.3% decrease)

Key Takeaway

Active inventory declined across every property type in July.

The largest declines came from semi-detached homes and freehold townhomes, while condo apartment inventory experienced a much smaller 4.3% decrease.

Even with fewer properties available than in June, Toronto buyers still have plenty of choice, particularly in the condo apartment market where more than 5,200 units remained actively listed.

What's interesting here is that inventory declined alongside sales.

Rather than new supply continuing to pile up while demand disappeared, July appears to have brought a broader slowdown in activity from both buyers and sellers.

Some of the inventory that accumulated throughout the spring and early summer is starting to come down.

The question now is whether that continues through August or whether we see inventory begin building again as sellers return for the fall market.

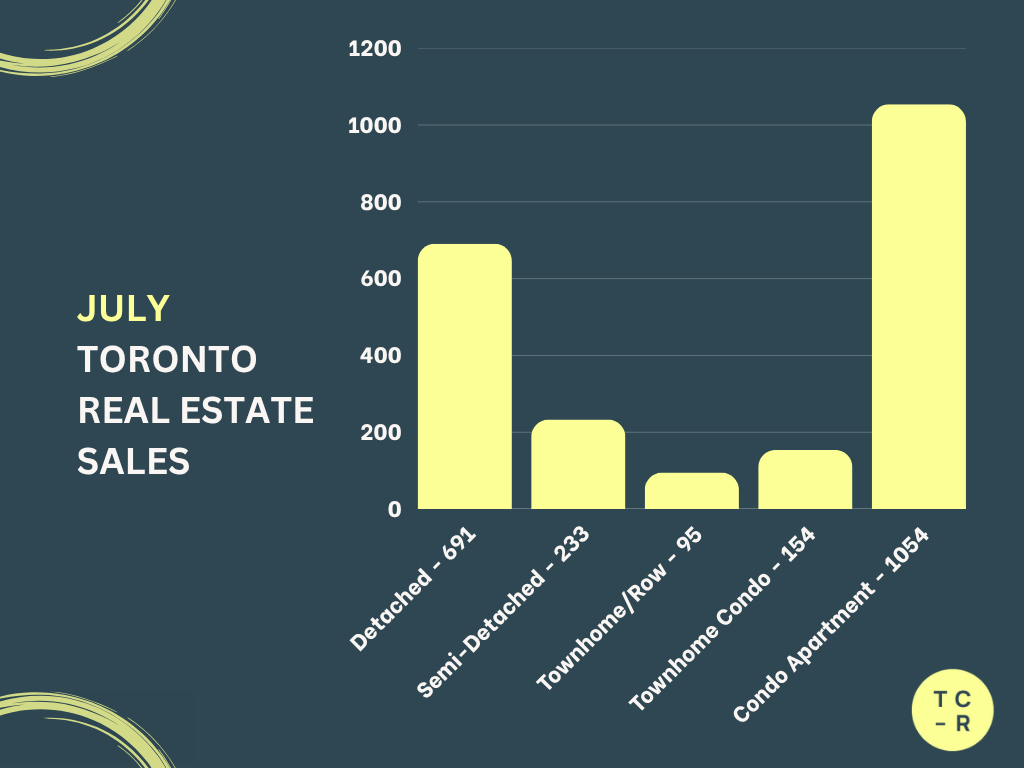
📊 SALES
Detached Homes

792 → 691 (12.8% decrease)

Semi Detached Homes

270 → 233 (13.7% decrease)

Freehold Townhomes

98 → 95 (3.1% decrease)

Condo Townhomes

139 → 154 (10.8% increase)

Condo Apartments

1,124 → 1,054 (6.2% decrease)

Key Takeaway

Sales activity slowed across most of the Toronto market in July.

Detached and semi-detached homes experienced the largest declines, while freehold townhome and condo apartment sales came down more modestly.

Condo townhomes were the exception, with sales actually increasing 10.8% from June.

Overall, buyers were still active, but there was clearly less activity than we saw during the spring market.

Again, considering July and August are typically the slowest months of the year for real estate, a decline in transactions isn't particularly surprising.

What I find more important is that sales didn't decline in isolation.

Fewer sellers were entering the market at the same time, which helps explain why active inventory actually declined rather than continuing to build.

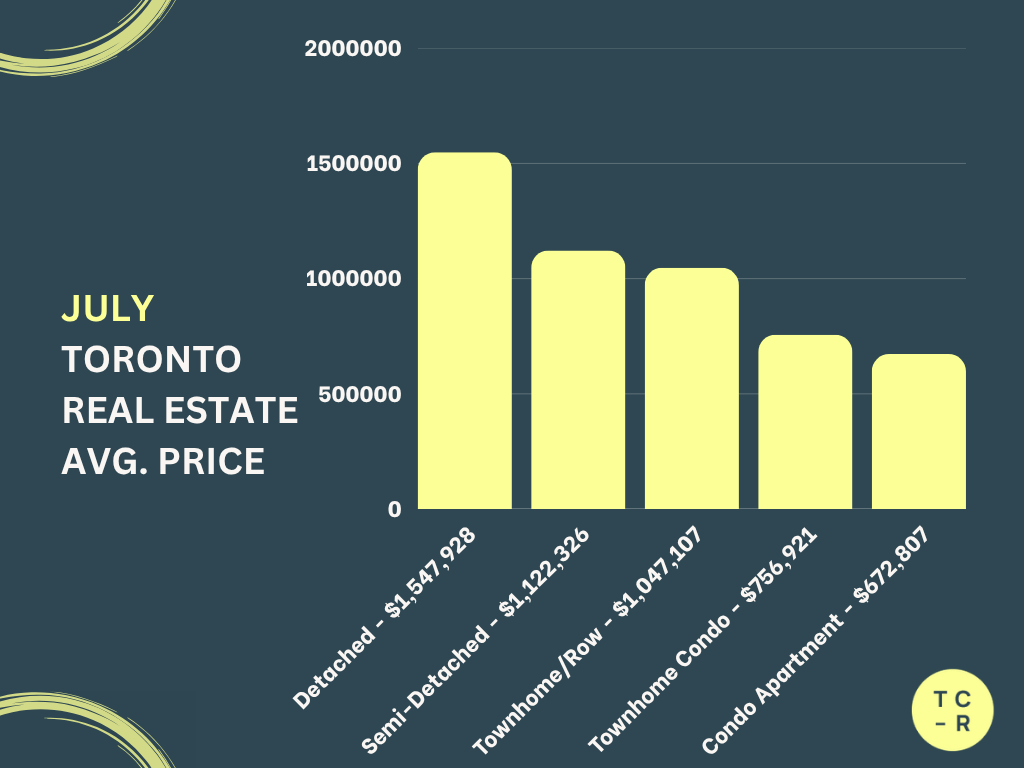
📊 AVERAGE PRICE
Detached Homes

$1,648,440 → $1,547,928 (6.1% decrease)

Semi Detached Homes

$1,264,782 → $1,122,326 (11.3% decrease)

Freehold Townhomes

$1,161,997 → $1,047,107 (9.9% decrease)

Condo Townhomes

$840,146 → $756,921 (9.9% decrease)

Condo Apartments

$665,760 → $672,807 (1.1% increase)

Key Takeaway

Average prices declined across every freehold category and condo townhomes in July, while condo apartments were the only property type to record an increase.

At first glance, some of these month-to-month declines look significant, particularly semi-detached homes, freehold townhomes and condo townhomes.

But average price is one statistic where I think we need to be particularly careful.

The average can change considerably from one month to another depending on the types, sizes, locations and price points of the homes that actually sold.

And when fewer transactions are taking place, the particular mix of properties that sold can have an even greater impact on the final number.

That doesn't mean we should ignore the declines.

Buyers are clearly remaining price-conscious and selective.

It simply means I wouldn't use one month of average-price data to declare that every semi-detached home in Toronto suddenly became 11% cheaper.

This is one of those statistics where we'll want to see what happens over the next couple of months before drawing any major conclusions.

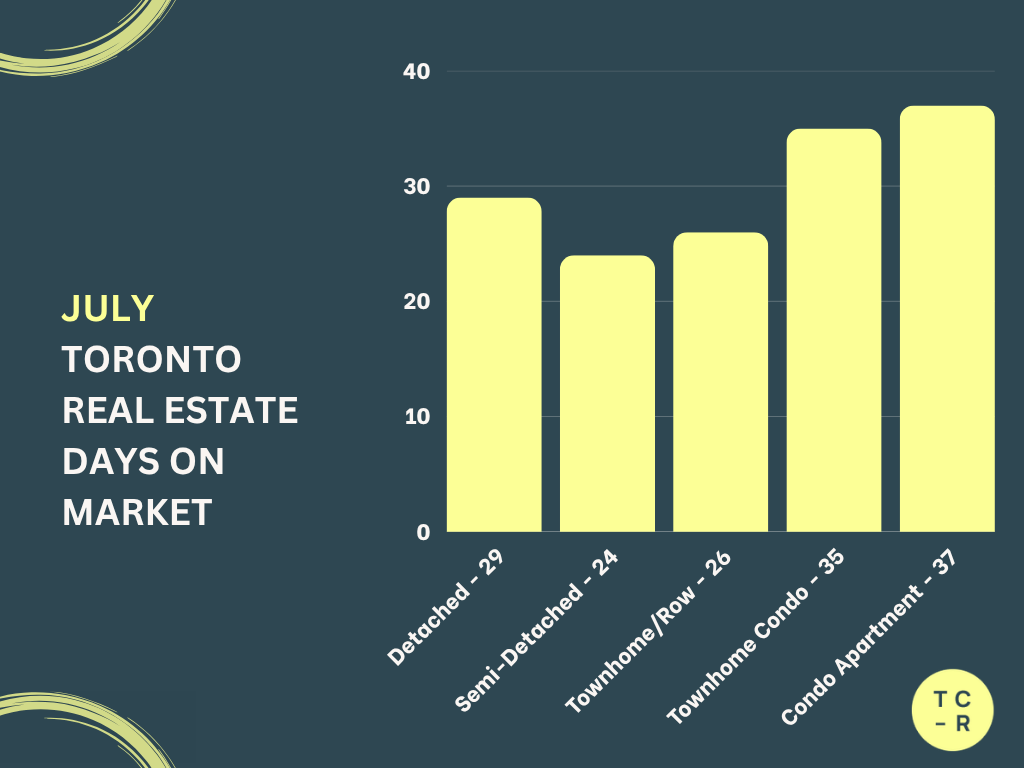
📊 DAYS ON MARKET BEFORE SOLD
Detached Homes

22 → 29 days (31.8% increase)

Semi Detached Homes

17 → 24 days (41.2% increase)

Freehold Townhomes

23 → 26 days (13.0% increase)

Condo Townhomes

32 → 35 days (9.4% increase)

Condo Apartments

37 → 37 days (no change)

Key Takeaway

Homes generally took longer to sell in July.

The biggest changes occurred with detached and semi-detached properties.

Detached homes moved from an average of 22 to 29 days on market, while semi-detached homes increased from 17 to 24 days.

Condo apartments remained unchanged at 37 days, while both freehold and condo townhomes experienced smaller increases.

This lines up with the broader picture we're seeing in July.

Buyers haven't disappeared, but they appear to be taking their time.

When there is less urgency in the market, buyers can compare properties, watch price changes and negotiate rather than feeling like they need to make a decision immediately.

For sellers, that makes pricing and presentation particularly important.

A home sitting on the market longer isn't necessarily a problem, especially during the summer months, but expectations need to match the market you're actually selling in.

So, What Does All of This Mean?

July looks like the Toronto real estate market taking a bit of a summer breather after the stronger activity we saw throughout the spring.

New listings were down.

Active listings were down.

Sales declined across most categories.

Homes generally took longer to sell.

And average prices softened across most property types.

But I wouldn't necessarily call this a major shift in the market, at least not yet.

July and August are usually the slowest months of the year for real estate, so a slowdown at this point in the calendar isn't particularly surprising.

People are on vacation, kids are out of school and buying or selling a home isn't always at the top of everyone's priority list when it's 30 degrees outside and there's a patio calling your name.

The most interesting part of July's numbers, at least to me, is what's happening with inventory.

If buyers were pulling back while sellers continued listing properties at the same pace, we'd expect active inventory to keep climbing.

That's not what happened.

New listings declined substantially, particularly in the freehold market, and active inventory declined across every property type.

In other words, buyers slowed down, but sellers slowed down too.

And in several categories, sellers actually pulled back considerably more.

That doesn't suddenly make this a seller's market.

Buyers are still taking their time, properties are generally taking longer to sell and there is still plenty of inventory available, particularly in the condo apartment market.

But it does mean the July numbers deserve a little more nuance than simply saying, "Sales and prices are down."

The market slowed.

Both sides of it did.

And that's exactly why the next couple of months should be particularly interesting.

August is traditionally another quiet month, so I'm not expecting the market to suddenly explode back to life.

September is where things could get interesting.

After Labour Day, we traditionally see buyers and sellers return to the market.

If new listings increase significantly while sales remain subdued, inventory could begin building again and buyers may find themselves with even more choice.

If buyers return at the same time as sellers, we could see a much more active and balanced fall market.

For now, July looks like exactly what you might expect in the middle of a Toronto summer:

A market taking a breather.

We'll see if it's ready to get back to work in September.

Ok! That's it for now. Thanks for reading and have a great day! 👋 - Tyson CR

Want to know what the current value of your home is or what's going on in your neighbourhood?
Please feel free to reach out! I'm happy to prepare a completely free, no obligation custom market report just for you.
If you or anyone is thinking of a move don't be shy and reach out.
After all, everyone's individual situation requires an individual and unique strategy and plan.

(Based on July 2026 sales, as reported in August. Toronto Specific)

Hello friends!

Well, we officially made it through July.

The sun was out, patios were full, people were away at cottages and on vacation, and, perhaps unsurprisingly, the Toronto real estate market seemed to take a bit of a vacation too.

After a fairly active spring market, July brought a noticeable slowdown across Toronto. Fewer homes came to market, fewer properties sold in most categories, homes generally took longer to sell and average prices softened across much of the market.

But before anyone starts ringing the alarm bells, context matters.

July and August are typically two of the slowest months of the year for Toronto real estate.

People are on vacation, kids are out of school, schedules change and, let's face it, spending a Saturday afternoon at an open house isn't always particularly appealing when it's 30 degrees outside and there's a patio calling your name.

So, seeing the market slow down in July isn't exactly surprising.

The more important question is how it slowed down.

And that's where this month's numbers get a little more interesting.

📈 Big Picture General Takeaways

The biggest theme in July was slower activity on both sides of the market, but particularly from sellers.

New listings declined across every property type, and in several categories the drop was substantial. Semi-detached new listings fell 36.7%, detached listings dropped 27.7%, freehold townhomes declined 24.1% and condo townhomes fell 22.2%.

Sales also declined across most categories, but generally not by nearly as much.

That's an important distinction.

If sales were falling while new listings continued pouring onto the market, we'd expect inventory to keep building.

Instead, the opposite happened.

Active listings declined across every property type in July.

That tells us the summer slowdown wasn't simply buyers stepping away from the market. Sellers pulled back too, and in several categories they pulled back considerably more.

Freehold properties still experienced some noticeable month-to-month price declines and generally took longer to sell, so I certainly wouldn't describe this as a suddenly competitive seller's market.

But the relationship between new listings, sales and active inventory is worth watching.

The condo market remains its own story. Condo apartments still had more than 5,200 active listings at the end of July, meaning buyers continue to have plenty of choice.

Condo townhomes, however, had a particularly interesting month, with new listings falling 22.2% while sales actually increased 10.8%.

Overall, July looks less like one side of the market suddenly disappearing and more like Toronto real estate collectively slowing down for the summer.

Before We Get Into the Numbers

I think July is a good example of why it's important not to look at one statistic in isolation.

You could look at average prices falling in four out of five property categories and assume the market suddenly took a turn for the worse.

But then you look at inventory and see that active listings declined across every single property type.

Then you look at new listings and see that fewer sellers brought their homes to market.

Then you look at sales and see that activity slowed, but certainly didn't disappear.

And then there's days on market, which tells us buyers are generally taking more time to make decisions.

Put all of that together and the picture becomes a little clearer.

This looks less like a market suddenly falling apart and more like a market that simply slowed down for the summer.

And again, July and August are usually the slowest months for Toronto real estate, so some degree of slowdown should be expected.

Of course, that doesn't mean we ignore the numbers.

The real test will come as we approach the fall market.

If buyers and sellers return after Labour Day, July and August may simply end up being the usual summer slowdown.

If activity remains subdued into September and October, then we'll have something much more interesting to talk about.

With that in mind, let's take a look at what the numbers actually show happened in Toronto this July.

You've read my personal opinion, but now here are the cold, hard numbers. 📊

Please note that these statistics cover only the City of Toronto. Not Richmond Hill, Not Mississauga, Not Vaughan, etc. If you would like to know what's happening in another area in the GTA, please reach out and let me know. I'm happy to chat!

Want to look on your own and see the numbers for yourself? Just ask and I'll send you the official statistics that every Real Estate agent gets sent from TREB and uses for their market updates.

These are the exact numbers I use for my Toronto updates and, if you want, I can prepare an update as detailed as this blog update for your city, neighbourhood and even street/building!

Don't be shy, reach out and just ask!

📊 NEW LISTINGS

Detached Homes

1,986 → 1,435 (27.7% decrease)

Semi Detached Homes

521 → 330 (36.7% decrease)

Freehold Townhomes

203 → 154 (24.1% decrease)

Condo Townhomes

437 → 340 (22.2% decrease)

Condo Apartments

2,915 → 2,690 (7.7% decrease)

Key Takeaway

New listings declined across every property type in July, and in some categories the drop was pretty significant.

Semi-detached homes saw the largest decline, with 36.7% fewer new listings hitting the market compared to June. Detached homes weren't far behind at 27.7%, followed by freehold townhomes at 24.1% and condo townhomes at 22.2%.

Condo apartments were the outlier. New listings still declined, but by a much more modest 7.7%.

Now, seeing fewer listings in July isn't particularly surprising. We're moving deeper into the summer and historically there simply aren't as many homeowners rushing to put a property on the market as there are during the spring.

But here's where things get interesting.

In most categories, new listings fell considerably more than sales did.

Detached listings fell 27.7%, while sales declined 12.8%.

Semi-detached listings fell 36.7%, while sales declined 13.7%.

Freehold townhome listings fell 24.1%, while sales declined only 3.1%.

And condo townhome listings fell 22.2%, while sales actually increased 10.8%.

That's an important piece of context.

Yes, buyer activity slowed in July, but sellers pulled back even more dramatically in several parts of the market.

So this isn't simply a story of buyers disappearing. There were fewer buyers making moves, but there were also considerably fewer new properties coming up for sale.

And as we'll see in the next section, that reduction in new supply was enough to start bringing Toronto's overall active inventory down as well.

📊 ACTIVE LISTINGS

Detached Homes

2,854 → 2,607 (8.7% decrease)

Semi Detached Homes

562 → 459 (18.3% decrease)

Freehold Townhomes

274 → 225 (17.9% decrease)

Condo Townhomes

824 → 727 (11.8% decrease)

Condo Apartments

5,464 → 5,228 (4.3% decrease)

Key Takeaway

Active inventory declined across every property type in July.

The largest declines came from semi-detached homes and freehold townhomes, while condo apartment inventory experienced a much smaller 4.3% decrease.

Even with fewer properties available than in June, Toronto buyers still have plenty of choice, particularly in the condo apartment market where more than 5,200 units remained actively listed.

What's interesting here is that inventory declined alongside sales.

Rather than new supply continuing to pile up while demand disappeared, July appears to have brought a broader slowdown in activity from both buyers and sellers.

Some of the inventory that accumulated throughout the spring and early summer is starting to come down.

The question now is whether that continues through August or whether we see inventory begin building again as sellers return for the fall market.

📊 SALES

Detached Homes

792 → 691 (12.8% decrease)

Semi Detached Homes

270 → 233 (13.7% decrease)

Freehold Townhomes

98 → 95 (3.1% decrease)

Condo Townhomes

139 → 154 (10.8% increase)

Condo Apartments

1,124 → 1,054 (6.2% decrease)

Key Takeaway

Sales activity slowed across most of the Toronto market in July.

Detached and semi-detached homes experienced the largest declines, while freehold townhome and condo apartment sales came down more modestly.

Condo townhomes were the exception, with sales actually increasing 10.8% from June.

Overall, buyers were still active, but there was clearly less activity than we saw during the spring market.

Again, considering July and August are typically the slowest months of the year for real estate, a decline in transactions isn't particularly surprising.

What I find more important is that sales didn't decline in isolation.

Fewer sellers were entering the market at the same time, which helps explain why active inventory actually declined rather than continuing to build.

📊 AVERAGE PRICE

Detached Homes

$1,648,440 → $1,547,928 (6.1% decrease)

Semi Detached Homes

$1,264,782 → $1,122,326 (11.3% decrease)

Freehold Townhomes

$1,161,997 → $1,047,107 (9.9% decrease)

Condo Townhomes

$840,146 → $756,921 (9.9% decrease)

Condo Apartments

$665,760 → $672,807 (1.1% increase)

Key Takeaway

Average prices declined across every freehold category and condo townhomes in July, while condo apartments were the only property type to record an increase.

At first glance, some of these month-to-month declines look significant, particularly semi-detached homes, freehold townhomes and condo townhomes.

But average price is one statistic where I think we need to be particularly careful.

The average can change considerably from one month to another depending on the types, sizes, locations and price points of the homes that actually sold.

And when fewer transactions are taking place, the particular mix of properties that sold can have an even greater impact on the final number.

That doesn't mean we should ignore the declines.

Buyers are clearly remaining price-conscious and selective.

It simply means I wouldn't use one month of average-price data to declare that every semi-detached home in Toronto suddenly became 11% cheaper.

This is one of those statistics where we'll want to see what happens over the next couple of months before drawing any major conclusions.

📊 DAYS ON MARKET BEFORE SOLD

Detached Homes

22 → 29 days (31.8% increase)

Semi Detached Homes

17 → 24 days (41.2% increase)

Freehold Townhomes

23 → 26 days (13.0% increase)

Condo Townhomes

32 → 35 days (9.4% increase)

Condo Apartments

37 → 37 days (no change)

Key Takeaway

Homes generally took longer to sell in July.

The biggest changes occurred with detached and semi-detached properties.

Detached homes moved from an average of 22 to 29 days on market, while semi-detached homes increased from 17 to 24 days.

Condo apartments remained unchanged at 37 days, while both freehold and condo townhomes experienced smaller increases.

This lines up with the broader picture we're seeing in July.

Buyers haven't disappeared, but they appear to be taking their time.

When there is less urgency in the market, buyers can compare properties, watch price changes and negotiate rather than feeling like they need to make a decision immediately.

For sellers, that makes pricing and presentation particularly important.

A home sitting on the market longer isn't necessarily a problem, especially during the summer months, but expectations need to match the market you're actually selling in.

So, What Does All of This Mean?

July looks like the Toronto real estate market taking a bit of a summer breather after the stronger activity we saw throughout the spring.

New listings were down.

Active listings were down.

Sales declined across most categories.

Homes generally took longer to sell.

And average prices softened across most property types.

But I wouldn't necessarily call this a major shift in the market, at least not yet.

July and August are usually the slowest months of the year for real estate, so a slowdown at this point in the calendar isn't particularly surprising.

People are on vacation, kids are out of school and buying or selling a home isn't always at the top of everyone's priority list when it's 30 degrees outside and there's a patio calling your name.

The most interesting part of July's numbers, at least to me, is what's happening with inventory.

If buyers were pulling back while sellers continued listing properties at the same pace, we'd expect active inventory to keep climbing.

That's not what happened.

New listings declined substantially, particularly in the freehold market, and active inventory declined across every property type.

In other words, buyers slowed down, but sellers slowed down too.

And in several categories, sellers actually pulled back considerably more.

That doesn't suddenly make this a seller's market.

Buyers are still taking their time, properties are generally taking longer to sell and there is still plenty of inventory available, particularly in the condo apartment market.

But it does mean the July numbers deserve a little more nuance than simply saying, "Sales and prices are down."

The market slowed.

Both sides of it did.

And that's exactly why the next couple of months should be particularly interesting.

August is traditionally another quiet month, so I'm not expecting the market to suddenly explode back to life.

September is where things could get interesting.

After Labour Day, we traditionally see buyers and sellers return to the market.

If new listings increase significantly while sales remain subdued, inventory could begin building again and buyers may find themselves with even more choice.

If buyers return at the same time as sellers, we could see a much more active and balanced fall market.

For now, July looks like exactly what you might expect in the middle of a Toronto summer:

A market taking a breather.

We'll see if it's ready to get back to work in September.

Ok! That's it for now. Thanks for reading and have a great day! 👋 - Tyson CR

Want to know what the current value of your home is or what's going on in your neighbourhood?
Please feel free to reach out! I'm happy to prepare a completely free, no obligation custom market report just for you.
If you or anyone is thinking of a move don't be shy and reach out.
After all, everyone's individual situation requires an individual and unique strategy and plan.

Like what you're reading? Stay Updated

Subscribe to receive the latest blog posts to your inbox every month.

Thank you! Your submission has been received!
Oops! Something went wrong while submitting the form.