January Toronto Real Estate Market Update

(Based on January 2026 sales, reported in February | 416 only)
January is never about momentum. It is about re-entry.
After December’s holiday slowdown, January gives us the first real look at how motivated buyers and sellers are heading into the new year. It is a reset month. Listings return. Buyers browse carefully. Offers happen, but selectively.
January 2026 followed that script almost perfectly.
Let’s break it down.
What’s Happening
Before diving into the stats, it’s important to frame what January usually represents in Toronto real estate and what it does not.
January is not a momentum month. It’s a calibration month.
The market is coming off a quiet December, where listings are low, activity is distorted by the holidays, and very little can be taken at face value. January is the first real opportunity to see how buyers and sellers behave when the lights come back on.
What typically happens is exactly what we saw this year. Sellers return faster than buyers. Inventory rebuilds. Buyers move cautiously, using January to compare options, track pricing, and get comfortable again before making decisions later in the winter or early spring.
That creates a market that can feel slower on the surface, but is actually doing something important underneath. It’s finding its footing.
Another key point to understand is that January is not about urgency. Buyers are rarely emotional this time of year. They are analytical. They ask more questions. They take more time. Sellers who expect fall level energy in January often misread the market and end up chasing it instead of leading it.
This is why January data should never be interpreted as weakness or strength in isolation. It’s about direction, not speed.
With that context in mind, the January numbers tell a clear story about supply returning, demand being selective, and pricing becoming increasingly segmented depending on property type.
The Numbers
You've read my personal opinion, but now here are the cold, hard numbers. 📊
Please note that these statistics cover only the City of Toronto. Not Richmond Hill, Not Mississauga, Not Vaughan, etc. If you would like to know what's happening in another area in GTA, please reach out and let me know. I'm happy to chat!
Want to look on your own and see the numbers for yourself? Just ask and I'll send you the official statistics that every Real Estate agent gets sent from TREB and uses for their market updates. These are the exact numbers I use for my Toronto updates and if you want, I can prepare an update as detailed as this blog update for your city, neighbourhood and even street/building!
Don't be shy, reach out and just ask!
📊 NEW LISTINGS
December to January
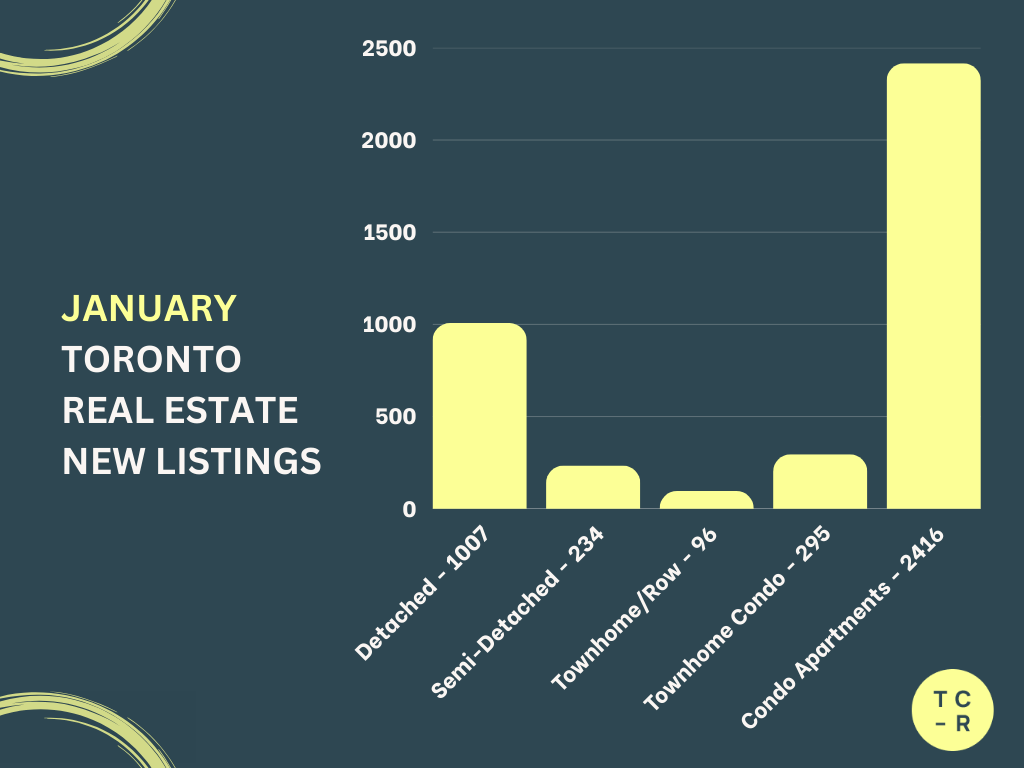
Detached:
451 → 1,007 (+123.28%)
Semi Detached:
105 → 234 (+122.86%)
Freehold Townhomes:
62 → 96 (+54.84%)
Condo Townhomes:
127 → 295 (+132.28%)
Condo Apartments:
1,193 → 2,416 (+102.52%)
Key Takeaway:
January saw a broad and expected rebound in new listings across every property type. Condos led the surge as sellers who waited out the holidays returned to the market in large numbers. This jump reflects seasonality, not stress. Sellers are testing the market early and watching buyer response closely.
📊 ACTIVE LISTINGS
December to January
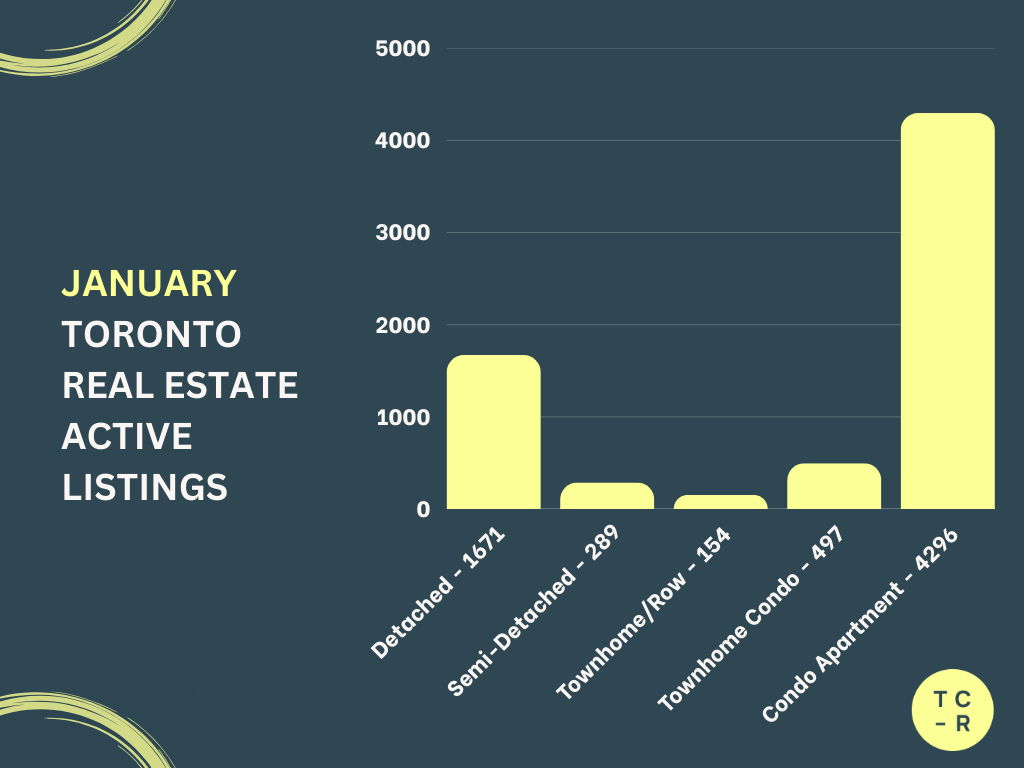
Detached:
1,588 → 1,671 (+5.23%)
Semi Detached:
266 → 289 (+8.65%)
Freehold Townhomes:
152 → 154 (+1.32%)
Condo Townhomes:
465 → 497 (+6.88%)
Condo Apartments:
3,927 → 4,296 (+9.39%)
Key Takeaway:
Active inventory increased modestly across all segments, with condos seeing the largest buildup. This confirms that January’s new listings were not immediately absorbed. Buyers have choice, especially in the condo market, and sellers are facing more competition.
📊 SALES
December to January
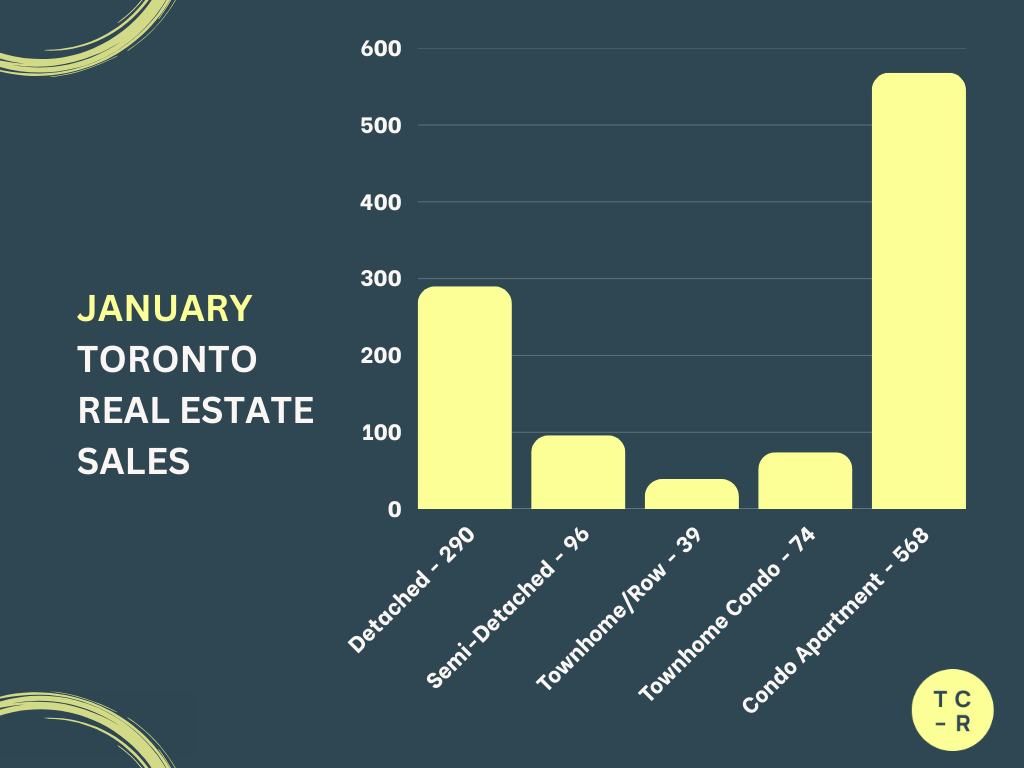
Detached:
413 → 290 (−29.78%)
Semi Detached:
122 → 96 (−21.31%)
Freehold Townhomes:
55 → 39 (−29.09%)
Condo Townhomes:
72 → 74 (+2.78%)
Condo Apartments:
694 → 568 (−18.16%)
Key Takeaway:
Sales softened across most housing types in January, which is typical for the first month of the year. Condo townhomes were the only segment to post a slight increase. Buyers are active but deliberate, prioritizing value and flexibility over speed.
📊 AVERAGE PRICE
December to January
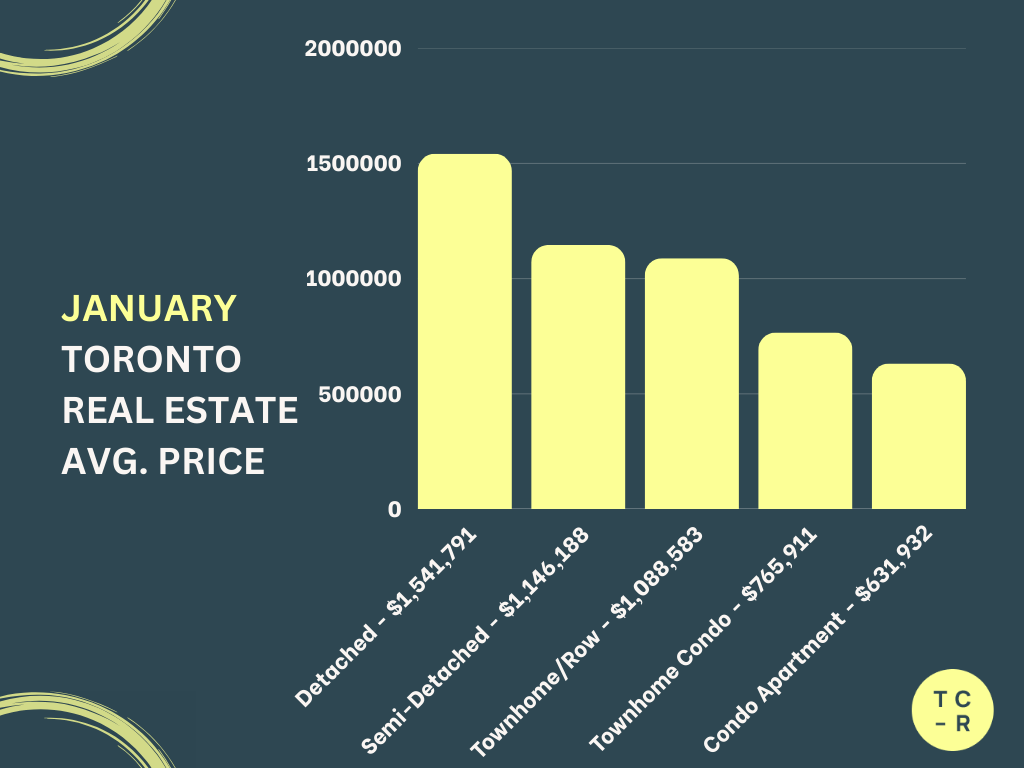
Detached:
$1,498,079 → $1,541,791 (+2.92%)
Semi Detached:
$1,122,309 → $1,146,188 (+2.13%)
Freehold Townhomes:
$1,226,914 → $1,088,583 (−11.28%)
Condo Townhomes:
$784,615 → $765,911 (−2.38%)
Condo Apartments:
$663,227 → $631,932 (−4.72%)
Key Takeaway:
Pricing moved in different directions depending on the segment. Detached and semi-detached prices increased modestly, largely driven by sales mix. Townhomes and condos saw price softness, reflecting increased choice and more price-sensitive buyers in those categories.
📊 DAYS ON MARKET
December to January
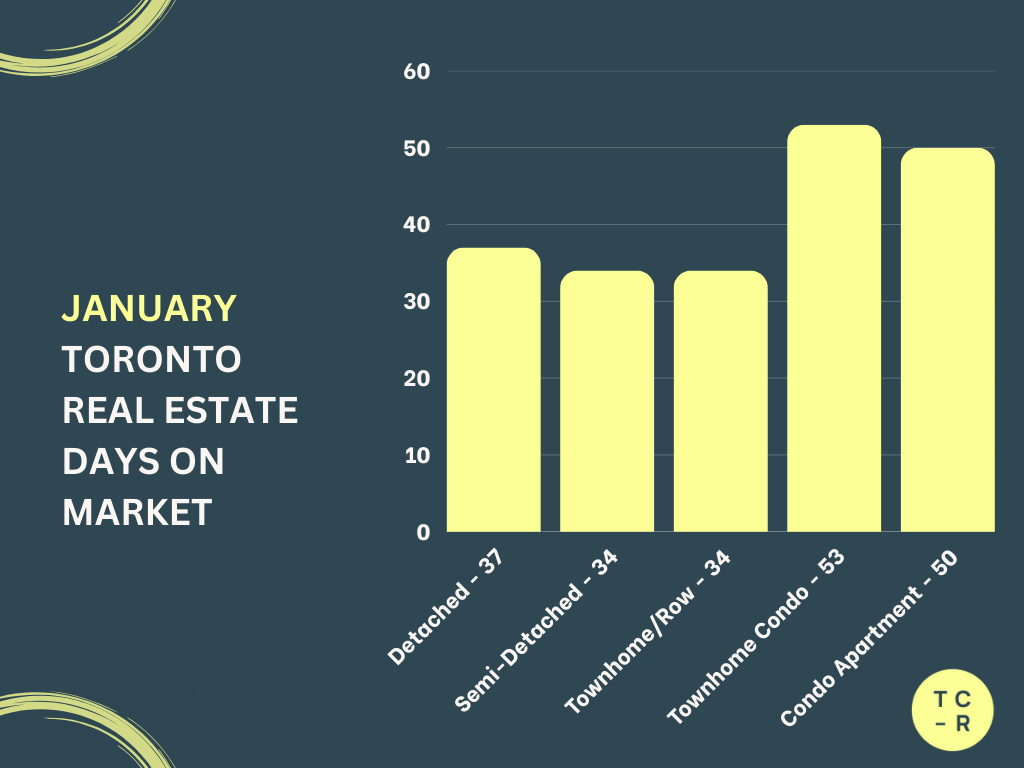
Detached:
37 → 37 (0.00%)
Semi Detached:
35 → 34 (−2.86%)
Freehold Townhomes:
39 → 34 (−12.82%)
Condo Townhomes:
40 → 53 (+32.50%)
Condo Apartments:
44 → 50 (+13.64%)
Key Takeaway:
Low-rise homes sold slightly faster in January, while condos took longer. The widening gap between freehold and condo days on market highlights where buyer confidence currently sits. Condos remain competitive and require sharper pricing and presentation.
Final Thoughts

January did what January is supposed to do. It slowed things down and clarified behaviour.
Supply returned quickly. Demand returned cautiously. That balance favours prepared buyers and disciplined sellers. There is no rush right now, and that is a good thing.
If you are buying, this is a strong window to observe, compare, and negotiate without pressure. If you are selling, early-year feedback is valuable. Pricing correctly now can save you time and adjustments later in spring.
February and March will tell us whether momentum builds or stalls, but January has already set the tone. This market is thoughtful, selective, and increasingly price-aware.
Ok! That's it for now. Thanks for reading and have a great day! 👋 - Tyson CR
Want to know what the current value of your home is or what's going on in your neighbourhood?
Please feel free to reach out! I'm happy to prepare a completely free, no obligation custom market report just for you
If you or anyone is thinking of a move don’t be shy and reach out.
After all, everyone’s individual situation requires an individual and unique strategy and plan.
Subscribe to receive the latest blog posts to your inbox every month.

