December Toronto Real Estate Market Update

December is always a quieter month in Toronto real estate, and this year was no different. With the holidays approaching, many buyers pause their searches and most sellers choose to wait until the new year. Activity slows, listings dry up, and the market settles into a year end rhythm.
December 2025 followed that familiar pattern. New listings dropped meaningfully, sales softened, and days on market stretched out. None of this signals trouble. It simply reflects seasonality in a market that has already adjusted over the course of the year.
Later in this report, we will also step back and look at how the market finished 2025 compared to the same time last year, which helps separate normal holiday slowdown from real year over year change.
Let’s break it down.
What’s Happening
By December, urgency is usually gone. Buyers who needed to move before year end have largely done so, and sellers who did not achieve their goals in the fall often decide to relist in the spring instead. That creates fewer listings, fewer sales, and more deliberate decision making.
What stood out this month was not weakness, but selectivity. Buyers who remained active were cautious and price sensitive. Homes that were well presented and realistically priced still sold. Others sat longer, which is exactly what you expect in December.
The Numbers
(416 only, City of Toronto)
Below are the Toronto specific results for December 2025. If you want a breakdown by neighbourhood, building, or street, I am always happy to prepare a custom report.
📊 NEW LISTINGS
November to December
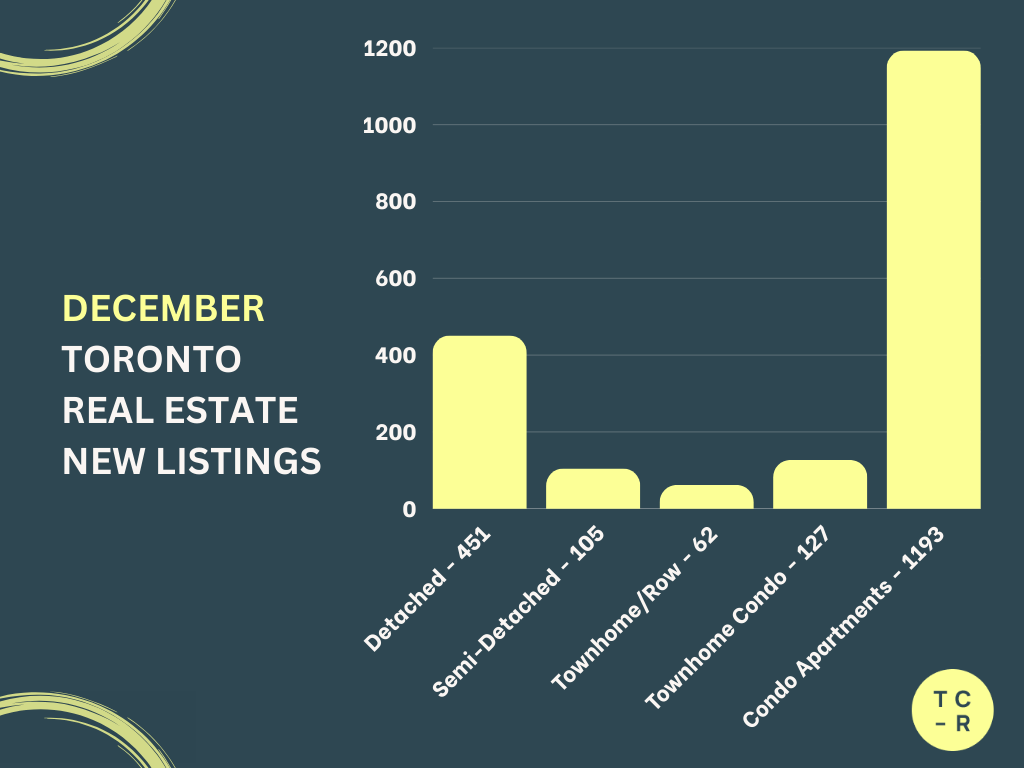
Detached:
1,232 → 451 (−63.39%)
Semi Detached:
303 → 105 (−65.35%)
Freehold Townhomes:
116 → 62 (−46.55%)
Condo Townhomes:
277 → 127 (−54.15%)
Condo Apartments:
2,207 → 1,193 (−45.95%)
Key Takeaway:
New listings fell sharply across every housing type in December. This is completely normal for the holiday season, especially in freehold segments where sellers prefer to wait for stronger spring demand. The pullback in supply helped prevent inventory from building during a slower sales month.
📊 ACTIVE LISTINGS
November to December
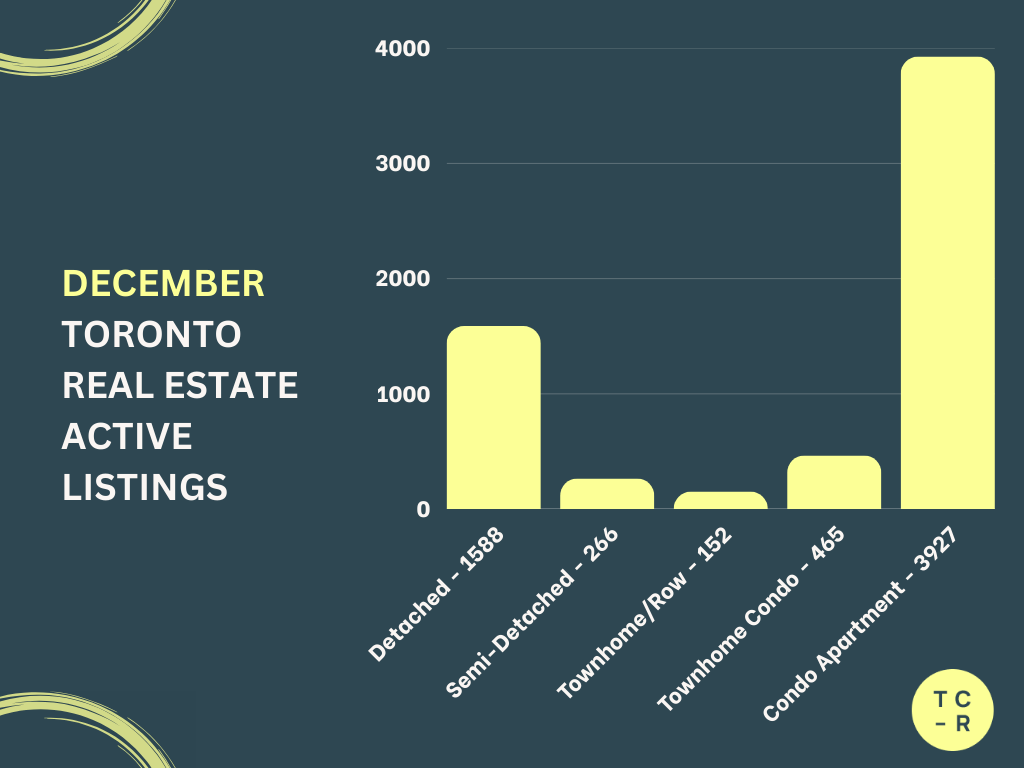
Detached:
2,562 → 1,588 (−38.01%)
Semi Detached:
468 → 266 (−43.16%)
Freehold Townhomes:
253 → 152 (−39.92%)
Condo Townhomes:
655 → 465 (−29.01%)
Condo Apartments:
5,339 → 3,927 (−26.46%)
Key Takeaway:
Active listings declined significantly in December, driven almost entirely by fewer new listings rather than stronger sales. Condos continue to offer the most choice, but even there, inventory tightened as the year wrapped up.
📊 SALES
November to December
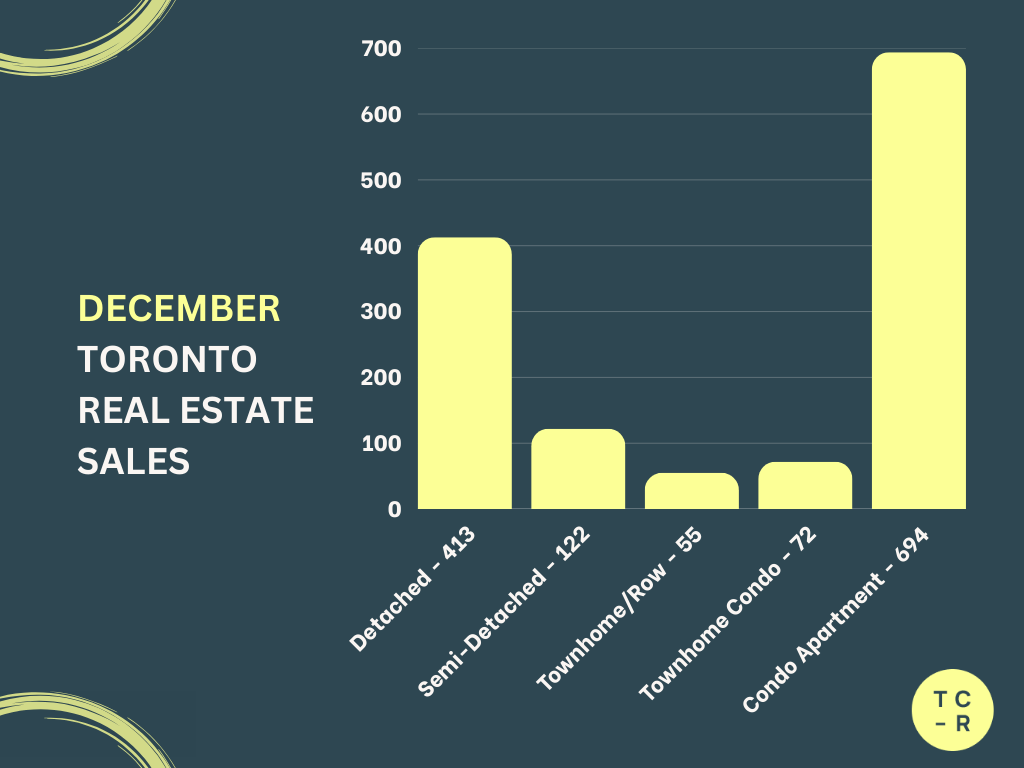
Detached:
600 → 413 (−31.17%)
Semi Detached:
209 → 122 (−41.63%)
Freehold Townhomes:
74 → 55 (−25.68%)
Condo Townhomes:
135 → 72 (−46.67%)
Condo Apartments:
880 → 694 (−21.14%)
Key Takeaway:
Sales slowed across all property types in December, which is expected during the holidays. Condos held up better than freeholds, reflecting continued end user demand at more attainable price points. The slowdown was orderly and seasonal.
📊 AVERAGE PRICE
November to December
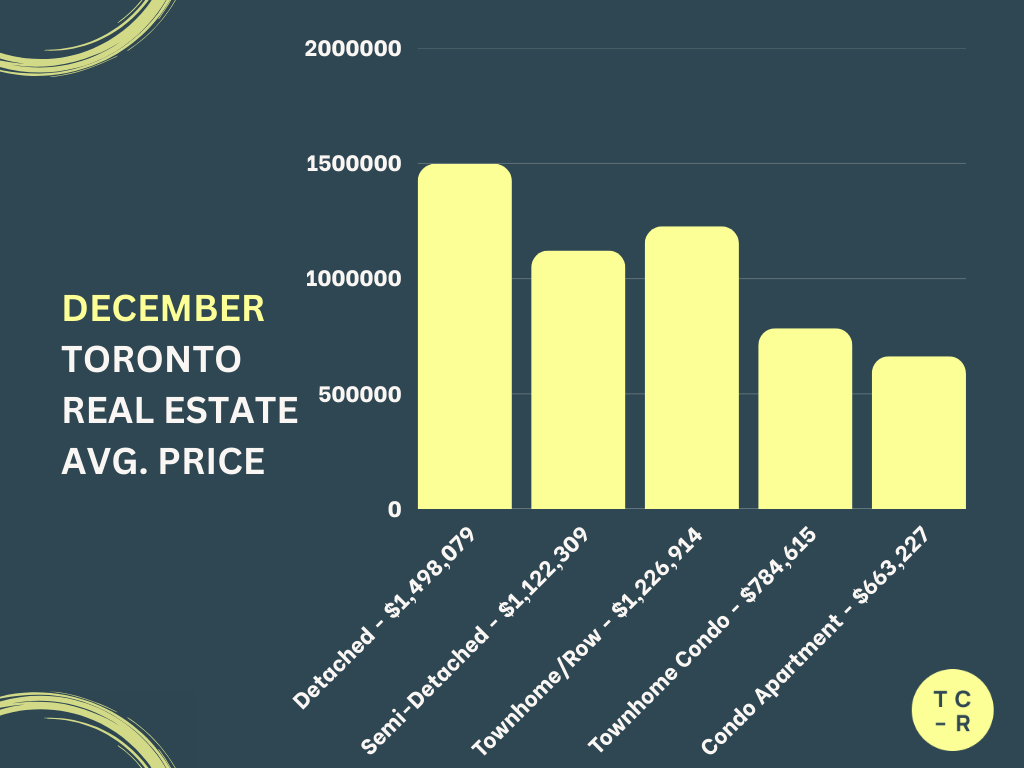
Detached:
$1,545,941 → $1,498,079 (−3.09%)
Semi Detached:
$1,187,111 → $1,122,309 (−5.46%)
Freehold Townhomes:
$1,069,006 → $1,226,914 (+14.77%)
Condo Townhomes:
$762,143 → $784,615 (+2.95%)
Condo Apartments:
$701,259 → $663,227 (−5.42%)
Key Takeaway:
Price movement varied by segment and was heavily influenced by sales mix. Freehold townhomes saw higher average prices due to limited supply and selective sales, while condos and semis softened modestly.
📊 DAYS ON MARKET
November to December
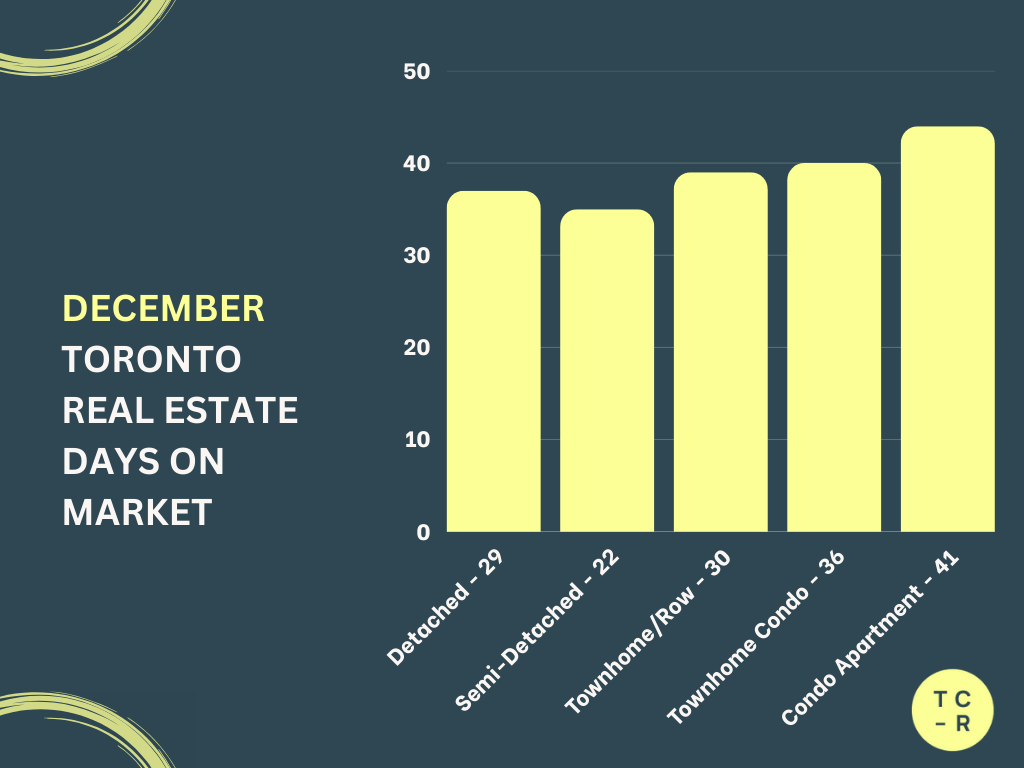
Detached:
29 → 37 (+27.59%)
Semi Detached:
21 → 35 (+66.67%)
Freehold Townhomes:
30 → 39 (+30.00%)
Condo Townhomes:
36 → 40 (+11.11%)
Condo Apartments:
41 → 44 (+7.32%)
Key Takeaway:
Homes took longer to sell across every category in December. Buyers who remained active were patient and selective, which rewarded realistic pricing and strong presentation.
Putting December Into Year End Context
Month to month data in December is always heavily influenced by seasonality. To understand how the market truly finished the year, it helps to step back and compare December 2025 with December 2024.
This comparison highlights what actually changed over the year, beyond the normal holiday slowdown.
How 2025 Ended Compared to 2024
December 2024 vs December 2025, 416 only
Detached Homes
Sales:
309 → 413 (+33.66%)
Average Price:
$1,205,000 → $1,498,079 (+24.33%)
Detached homes closed 2025 significantly stronger than the year before. Higher sales and much stronger pricing reflect improved confidence and tighter year end supply.
Semi Detached Homes
Sales:
113 → 122 (+7.96%)
Average Price:
$1,088,543 → $1,122,309 (+3.10%)
Semis showed modest improvement year over year, with stable demand and controlled price growth.
Freehold Townhomes
Sales:
43 → 55 (+27.91%)
Average Price:
$1,015,505 → $1,226,914 (+20.82%)
Freehold townhomes stood out as one of the strongest year end performers, driven by limited supply and consistent buyer demand.
Condo Townhomes
Sales:
93 → 72 (−22.58%)
Average Price:
$803,088 → $784,615 (−2.30%)
Condo townhomes cooled compared to last year, with fewer sales and slightly softer pricing as buyers compared value across segments.
Condo Apartments
Sales:
606 → 694 (+14.52%)
Average Price:
$681,855 → $663,227 (−2.73%)
Condo apartments finished the year with higher sales but lower average pricing, reflecting increased activity at more affordable price points.
Final Thoughts

December wrapped up the year quietly and predictably. Activity slowed, listings thinned out, and buyers took their time. That is exactly how a healthy Toronto market behaves at year end.
When you zoom out and compare December 2025 to December 2024, the bigger picture becomes clearer. The market did not weaken over the past year. It adjusted. Freehold properties regained strength, sales activity improved in most segments, and pricing became more realistic rather than inflated. Condos remained active but price sensitive, giving buyers more choice and leverage.
As we head into 2026, calmer conditions like these often create the best opportunities for people who plan ahead instead of reacting to headlines. Understanding your specific neighbourhood, property type, and timing will matter more than ever.
Ok! That's it for now. Thanks for reading and have a great day! 👋 - Tyson CR
Want to know what the current value of your home is or what's going on in your neighbourhood?
Please feel free to reach out! I'm happy to prepare a completely free, no obligation custom market report just for you
If you or anyone is thinking of a move don’t be shy and reach out.
After all, everyone’s individual situation requires an individual and unique strategy and plan.
Subscribe to receive the latest blog posts to your inbox every month.

